|
|
Microscopy Construction
Build Your Own Video-Rate 2-photon Microscope
|
Two-photon (2-P) microscopy offers several advantages for biological imaging - in particular for non-injurious imaging of dynamic cell behaviors deep within intact tissues, organs and even the living animal [Cahalan et. al., 2003, Stutzmann et al., 2005]. However, its widespread adoption for such applications has been hindered by two factors: commercial 2-P microscopes are very expensive, and they typically acquire images at frame rates too slow to resolve many biological processes. Both of these problems may be circumvented by building your own 2-P microscope!
I first built a video-rate (30 frames s -1) 2-P system in 2001, which has proved extremely useful for applications including imaging immune cell interactions within lymph nodes, visualizing vesicular exocytosis in pancreas, and studying neuronal calcium signaling disruptions in Alzheimer’s disease [2-Photon Bibliography]. We have now (Dec. 2005) just finished construction of a third version. Over the years the design of the hardware and software has evolved (with particular contributions from Mike Sanderson and Max Krummel), so that the system has become both more capable and easier to construct.
Several papers describe the construction of our video-rate 2-P design [Nguyen et al., 2001], and the video-rate confocal microscope on which it is based [Callamaras et al., 1999 and Sanderson et al., 2002]; further information is also available elsewhere on this [Video-Rate Multi-photon & 2G2P] and other websites [Sanderson & Krummel]. However, this information is rather dispersed, and in some cases is becoming out of date. The object of this web page is to gather together all the information you should need to build your own 2-P microscope.
|
 Confocal Microscope, picture taken from Mike Sanderson's website, was designed in
collaboration with Mike Sanderson and captures 30 images per second at 400x 400 pixels.
|
The primary advantages of building this system are:
1. Cost (<1/2 the cost of buying a commercial instrument: and no currently-available commercial systems match the capabilities of our 2-P design).
2. Four channel acquisition (eg. red, green, blue fluorophores plus second-harmonic signal).
3. Acquisition speed variable from 15-120 fps (at pixel resolutions from 450x900 to 450 x 80). (Deep-tissue applications may require frame averaging to increase the signal/noise, but video rate and faster is possible with a sufficiently bright signal).
4. Simple, optimized path for excitation and collection of emitted light.
5. Can be used with your choice of microscope (upright/inverted: Olympus, Nikon, etc) and laser (Coherent/Spectra-Physics)
6. It is easier to construct than you might think! Software drivers are now commercially available, a printed circuit board is available for the electronics, and Sutter Instruments can provide mechanical parts. In the process of construction you become very familiar with the instrument and its operating principles, so you can adapt it for your own applications and fix it if it breaks.
7. Building and then doing experiments with your own instrument is fun and highly satisfying!
|
OPERATING PRINCIPLES AND CONSIDERATIONS |
Non-linear multi-photon excitation vs. conventional linear fluorescence microscopy
Conventional linear (i.e. single-photon) fluorescence imaging techniques that can be used to provide multi-dimensional (x, y, z, time, wavelength) information from thick tissues or organs include widefield microscopy in conjunction with deconvolution processing and confocal microscopy. In both cases, short wavelength light (usually UV, blue or green) is used to excite fluorophore in labeled cells, and the resulting emission at a slightly longer wavelength is used to form the image. This results in several disadvantages that severely restrict the applicability of linear fluorescence imaging for live cell studies. A general problem is that the short (high-energy) excitation wavelengths exacerbate phototoxicity, and cause rapid bleaching. More specifically, light scattering limits the depth to which satisfactory images can be obtained within biological tissues. The effects of light scattering can be mitigated either by re-assigning the positions of emitted photons by deconvolution, or by blocking the detection of scattered photons by confocal microscopy. However, neither approach is a panacea, and the practicable depth penetration is only a few tens of micrometers.
The application of non-linear multiphoton excitation techniques substantially overcomes many of these problems, providing an order-of-magnitude improvement in depth to which good images can be obtained in living tissue, and the relatively innocuous nature of the excitation light permits long-term imaging with minimal photodamage.
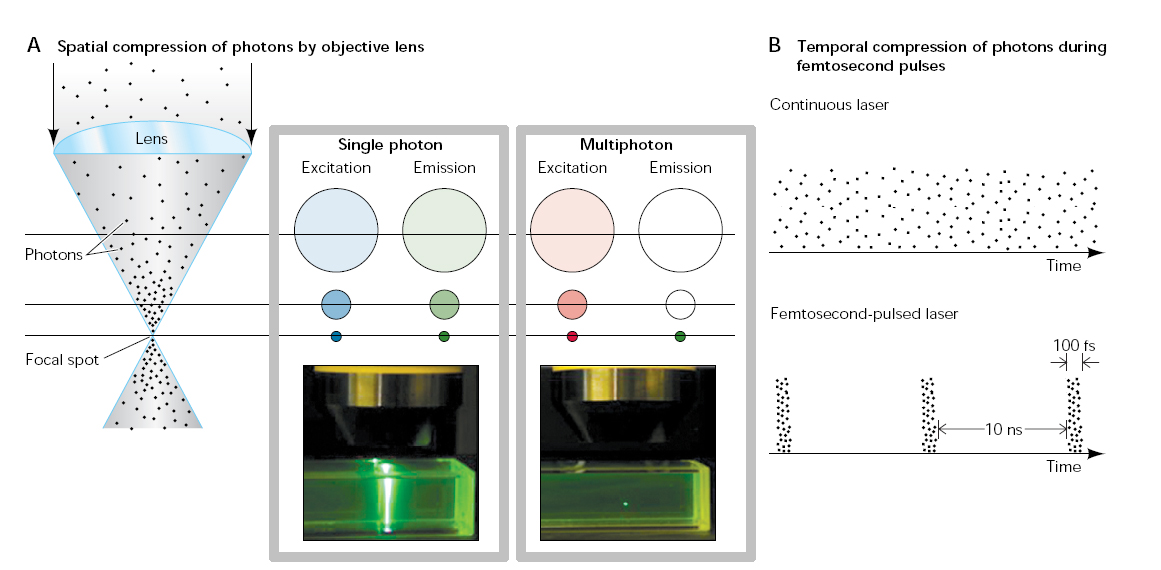
The technology of multiphoton excitation has been extensively reviewed [e.g. Stutzmann et al., 2005] The essence is that a fluorophore is excited by the near-simultaneous absorption of energy from two photons, each of which contributes one half of the energy required to induce fluorescence (Go to Olympus Microscopy Resource Center for interactive Java tutorials). Because of this quadratic dependence on excitation intensity fluorescence is constrained to the focal spot formed by the microscope objective, thereby providing an inherent ‘optical sectioning’ effect. However, in order to achieve practicable fluorescence signals, the photon density in the focal spot must be incredibly high - yet without damaging the specimen. This is achieved by use of femtosecond or picosecond pulsed lasers, which concentrate their output into brief bursts with enormous instantaneous power. Typically, each pulse lasts ~100 fs, with intervening gaps of ~100 ns between pulses. So, the temporal compression is by a factor of 10 to the power of 5 and, because of the quadratic relationship for two-photon excitation, fluorescence is enhanced by a factor of 10 to the power of 10 as compared to a continuous laser of equivalent average power.
|
| |

2-photon principle
click the image to view at full resolution |
|
Advantages of 2-P microscopy
Multiphoton microscopy thus provides images that represent an optical section within a tissue. These are closely analogous to confocal sections, but the means by which the sectioning effect is achieved are very different. In confocal microscopy fluorescence excitation occurs throughout the depth of the tissue and out-of-focus fluorescence is rejected by the pinhole; in multiphoton microscopy there essentially is no out-of-focus signal. However the principal features of multiphoton excitation that make it attractive for biological imaging accrue secondarily from the use of excitation wavelengths that are roughly twice as long (half the energy) as would be used for conventional linear excitation by widefield or confocal microscopy. Ranked subjectively in order of importance these are;
1. Light scattering by particles (primarily organelles) in biological tissue decreases with increasing wavelength, and absorption by hemoglobin and other proteins is minimized at long wavelengths. Thus, the infra-red wavelengths (700-1200 nm) used for two-photon imaging allows at least a five-fold deeper tissue penetration than confocal imaging. This is of crucial importance for imaging into intact, complex tissues such as the lymph node, where cells and cell interactions may localized within structures hundreds of micrometers below the surface.
2. Infrared wavelengths cause negligible photodamage or phototoxicity. Long-term imaging is thereby facilitated because damage processes (by multiphoton excitation) are largely confined to those cells lying at the focal plane, and cells above and below experience only the innocuous infrared light. For the same reason, photobleaching of fluorescent probes is minimized and, unlike confocal microscopy, occurs only in those cells actually being imaged.
3. The two-photon excitation spectra of most fluorophores are broader than for one-photon excitation [Dickinson et al., 2003], so a single excitation wavelength can be used to efficiently and simultaneously excite multiple probes with distinct emission wavelengths.
Imaging speed
In 2-P microscopy fluorescence is excited only at the focal laser spot. To form an image (an x-y optical ‘section’ in the tissue) it is therefore necessary to raster scan the laser spot. The rate at which this can be achieved is constrained both by instrumental considerations (how fast can the scan mirrors move) and, ultimately by signal-to-noise considerations (can a useful number of photons be detected during the pixel dwell time).
Commercial instruments almost all employ galvanometer-driven scan mirrors driven by sawtooth waveforms to provide a liner scan in x and y axes. Mechanical inertia limits the maximum linescan speed to around 1 ms, so the maximum frame-rate for a 500 line x-y image is only about 2 per second: insufficient to resolve phenomena such as cellular calcium signals or rapid cell motility.
Instead, we achieve a much faster imaging rate by employing a resonant mirror to achieve a fast linescan (18 kHz) in the x axis, allowing frame rates (500 line image) of 30 per second. The x-scan mirror is driven by a resonant galvanometer (CRS: Lumonics), which undergoes rotational vibration at a fixed resonant frequency (ca. 9kHz) set by its mechanical construction (rotational inertia and torsional rigidity of the coupling rod). By acquiring images during the forward and backward rotations of the mirror it is thus possible to scan a line in the x dimension every 64 ms. The horizontal pixel resolution is set by the sampling interval – we typically sample at 12 MHz (pixel dwell time of 83 ns), providing a horizontal resolution of about 500 pixels. Scanning in the y axis is achieved by a conventional galvanometer mirror, driven by a linear sawtooth waveform synchronized to the x-scan such that flyback occurs every 512 lines (for 30 Hz imaging).
Image corrections for sinusoidal scanning
Use of resonant x-scanning allows high speed, but introduces two problems;
1. Lines are alternately scanned in right-left and left-right directions, so that ‘odd’ lines must be ‘flipped’ to construct the final image.
2. The scan is sinusoidal, not linear, so that objects near the edge of the field appear increasingly elongated. Corrections for both of these factors can be incorporated in software, as described on Mike Sanderson’s website.
|
Selection of pulsed lasers for 2-P excitation
The availability of lasers that produce brief (ca. 1 ps or shorter) pulses at infrared wavelengths has been the key factor driving the development of two-photon microscopy, and progressive improvements in tuning flexibility and ‘user friendliness’ have increased their applications by biologists. Two-photon studies to date have primarily utilized mode-locked Ti-sapphire lasers (Coherent, Inc. and Newport Corp., Spectra-Physics), that have advantages of high output power (approaching 2W) combined with the ability to tune over a range of about 700-1000 nm. The latest generation feature a ‘briefcase size’ laser head, run from a regular wall outlet, and are operated entirely by computer control, with no mechanical adjustments and no requirement for periodic alignment or maintenance. Their only significant disadvantages are high cost (ca. $150,000) and inability to tune to wavelengths >1 micrometer. Various designs of diode-pumped solid-state (DPSS) femtosecond lasers offer a less expensive alternative at long wavelengths that would be applicable for imaging fluorescent proteins or for three-photon imaging, but the inability of DPSS lasers to tune over a broad range restricts their versatility.
Average excitation intensities at the specimen must typically be restricted to a few tens of mW in order to minimize photodamage, so that lasers with outputs >1 W may seem like overkill. However, it is wise to purchase the most powerful laser that can be afforded. Firstly, the maximum output is specified at the peak of the tuning range, and the power falls precipitously toward the edges of the curve. Secondly, scattering losses require higher excitation powers when imaging deep into tissues, and we often find that the imaging depth is limited by lack of excitation power rather than by degradation of image resolution. Because Ti-sapphire lasers operate properly only when producing near their specified output, it is necessary to attenuate the beam so as to regulate excitation at the specimen. This can readily be accomplished using a continuously variable reflective neutral density filter, but it is difficult to manually adjust the intensity to counteract the effect of increasing tissue depth while capturing deep image stacks. A more elegant approach (implemented by Mark Miller is to use a Pockel’s cell as a computer-controlled attenuator and shutter to regulate excitation intensity in parallel with command signals to the microscope focus motor.
Choice of objective lenses
Microscope objectives for biological two-photon imaging must have good infrared transmission and correction, and possess a high numerical aperture both to form a smaller diffraction-limited excitation spot and to collect as much emitted fluorescence as possible. Moreover, it is convenient to use ‘dipping’ water immersion objectives so that the specimen (excised tissue or in vivo preparation) can be superfused with warmed, oxygenated solution. We have had good success with the Olympus 20x, 0.95 NA dipping objective - which combines high NA, wide field of view and long (2 mm) working distance - and a new generation of Olympus water dipping objectives offer even higher NA at higher magnifications. Objectives designed for IR DIC imaging also work well.
Detectors
In a single-spot scanned two-photon microscope all emitted fluorescence - even that which is highly scattered - provides useful signal since it originates at a known point. Optimal detection from lymphoid tissue is thus achieved by using large area non-descanned detectors, ideally placed close to the back aperture of the objective to maximize collection on non-collimated (highly scattered) photons. These criteria effectively limit the choice of detectors to photomultipliers (PMTs) which, although having lower quantum efficiency than semiconductor devices (ca. 0.4 vs 0.9 at visible wavelengths), are available with wide active areas and low dark counts. Multiple PMTs are typically employed together with appropriate dichroic mirrors and emission filters to monitor simultaneously the fluorescence from different probes with differing emission spectra: for example, to visualize interactions between green-labeled dendritic cells and red T cells, or for Ca 2+ measurement using the ratiometric probe indo-1. An alternative would be to use an imaging detector with high quantum efficiency (e.g. a cooled, back-illuminated c.c.d. camera) to integrate an image during each raster scan, but this is likely to be unsatisfactory for deep imaging into tissues as scattered light will degrade the image quality.
|
HISTORICAL BACKGROUND TO THE PARKER/SANDERSON VIDEO-RATE SCANNER |
Many labs have built custom 2-P microscopes, either constructing scan systems from scratch or modifying commercial confocal scanners. Here, I concentrate only on video-rate instruments based on a resonant scanner.
The first published design utilizing a resonant scanner was a confocal microscope constructed by Bacskai and Tsien (Tsien, R. Y., and B. J. Bacskai. 1995. Video-rate confocal microscopy. In Handbook of Biological Confocal Microscopy. J. B. Pawley, editor. Plenum press, New York. 459-478 – not available online). This design was exceedingly complex, as the alternate line flipping and correction for sinusoidal distortion were implemented by custom hardware. I am not aware of any other lab copying the design, although it was used as a basis for a commercial instrument (Nikon RCM 8000; later adopted by BioRad). Sales were limited, and that microscope is no longer available.
Soon after publication of the Tsien design, rapid developments in computer technology (the introduction of the PCI bus and concurrent availability of analog video boards) allowed a great simplification, by allowing all of these corrections to be achieved in software. In 1999 I built a video-rate confocal microscope utilizing the same resonant scanner [Callamaras et al.,1999], but employing a Data Translation video board and custom software “e-maging”; written by Quoc-Thang Nguyen to construct the final image.
That design was copied by other labs, most notably by Mike Sanderson, who worked in conjunction with the software company IO Industries to develop drivers for their Video Savant product that support the resonant-scan microscope.
Subsequently, I constructed a 2-P microscope based on the same scan design as the video-rate confocal, but employing femtosecond pulsed laser excitation and widefield photomultiplier detectors [Nguyen et al., 2001]. We have found this to be an extremely useful instrument [2-photon bibliography]. The design has been duplicated by several labs Sanderson, Krummel, Sedgewick; and it has become a tradition among postdocs (Mark and Grace) leaving my lab for faculty positions that they construct a 2-P microscope to take with them!
Development of this resonant video-rate design has evolved as an informal open-source project, with users/constructors each contributing various improvements. The version described here was built in Oct-Dec 2005 by Grace Stutzmann, and incorporates most of the latest advances. |
OVERVIEW
Take-home message: building your own 2-photon microscope is not as difficult as you might think. Here, I hope to provide enough information to enable you to undertake this task without undue difficulty. If you get stuck, feel free to e-mail me (iparker@uci.edu) or Mike Sanderson (Michael.Sanderson@umassmed.edu).
The system described is truly ‘home-made’, as I enjoy machining parts and soldering electronics. If you do not want to do this, contact Sutter Instruments who constructed custom parts and electronics for Max Krummel at a cost of $30,000.

(back view)
|

Grace's two-photon
(front view)
|
 (side view)
|
click any of the annotated images above to view them at full resolution. |
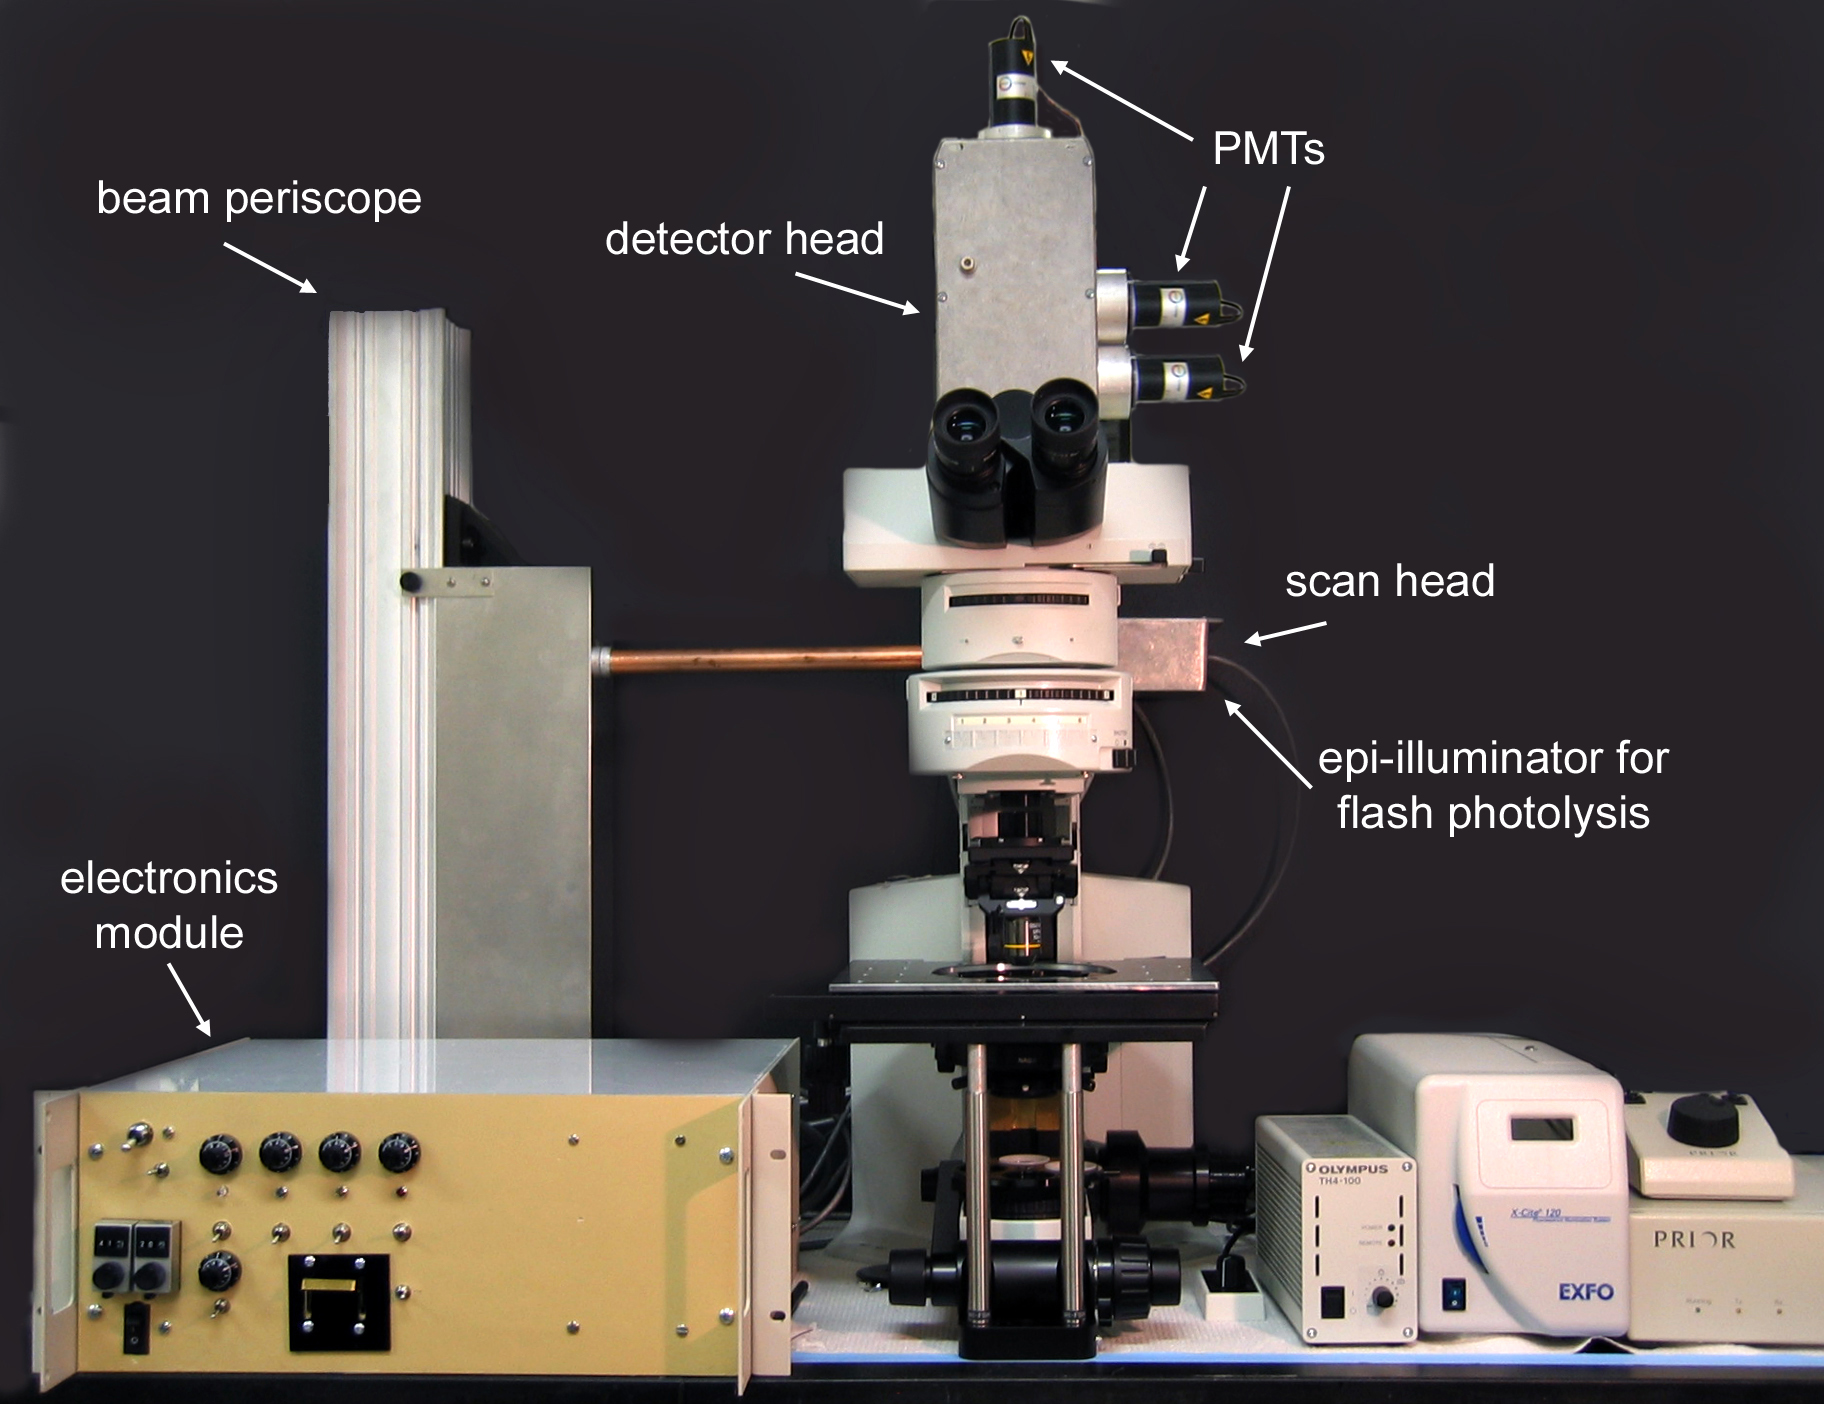
This photo (above) shows a complete system we recently assembled for use by Grace Stutzmann. It is constructed around an Olympus upright microscope, but any other microscope – Nikon, Zeiss; upright or inverted – could be similarly adapted with only minor modifications in mechanical fitments. To make things simple, we divide the custom components into 4 modules, plus the acquisition computer and software, and miscellaneous items.
1. The electronics module. A free standing or rack-mounted enclosure containing all the necessary electronics.
2. The scan head. A module (metal box) containing the scan mirrors and scan lens, fitted with a dovetail adaptor so it ‘plugs’ onto a modified Olympus reflected light illuminator.
3. The detector head. Another metal box with Olympus mounting dovetail. It fits onto the eyepiece head of the microscope, contains dichroic cubes for separating different wavelengths of emitted fluorescence light, and has mounts to accept 3 photomultiplier detector modules.
4. A beam periscope, holding two steering mirrors to elevate and direct the laser beam into the scan head, and a circular neutral density wheel to allow continuous attenuation of the laser intensity.
5. Computer and software. A PC, containing a Raven video acquisition card, running Video Savant software with custom routines.
6. Miscellaneous items; including optical, vibration isolated table.
**click here for a complete parts inventory (excel doc.).
|
The electronics module is housed in a rack-mount cabinet, and provides all controls and drive signals necessary for operating the scan head and the detector head.
Specifically, the module contains circuits that;
1 Provide drive signals to the x and y scan mirrors, allowing user control of scan amplitude (image ‘zoom’) and scan speed (15, 30, 60 or 120 frames per second)
2. Provide synchronization pulses – line (horizontal) and frame (vertical) – to drive the video acquisition card.
3. Allow control of photomultiplier gain (image brightness) by both front panel knobs and computer control.
The main components are: a custom printed circuit board containing most of the circuitry; two circuit boards supplied with, and driving the horizontal and vertical scan mirrors; power supplies ( +/- 5 V and +/- 15 V); front panel controls (potentiometers to control PMT gains and scan magnification, switches to control scan zoom etc; back panel connectors to interface synchronization signals to the acquisition computer, and interface to the scan head and detector head modules.

Electronics module
click the image to view at full resolution |
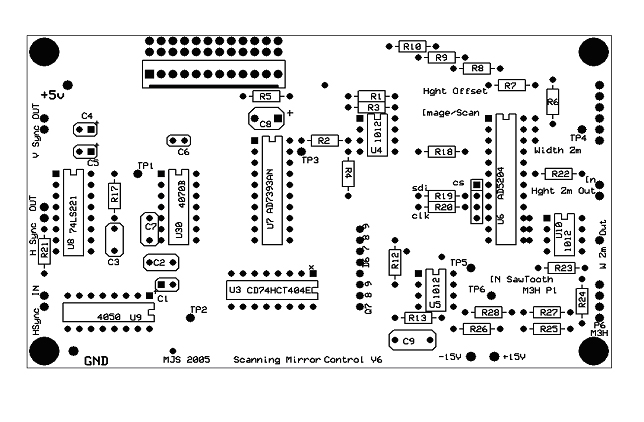
Printed circuit board
Construction of the electronics has been enormously facilitated by the efforts of Mike Sanderson in developing a custom printed circuit board (pcb) – the days of hand-wiring the circuitry are now gone. If you want this pcb you can either e-mail me (iparker@uci.edu) to see if I have one spare, or order your own.
To order, go to Express PCB Website and download their software. The website has easy to follow instructions. You can then load files for the circuit schematic and the board layout. If you simply want to have copies of this existing board layout made, import the board layout file into the ExpressPCB utility, click on ‘layout’ in the menu bar and select ‘order boards via the internet’. Fill in shipping details, select the ‘ProtoPro’ service option, order a minimum of 4 boards, and give them your credit card number. Current cost (Jan 06) is around $170 for 4 boards. If you want to add your own custom features to the circuit, the ExpressPCB software lets you easily modify Mike’s existing layout; or you could start from scratch!
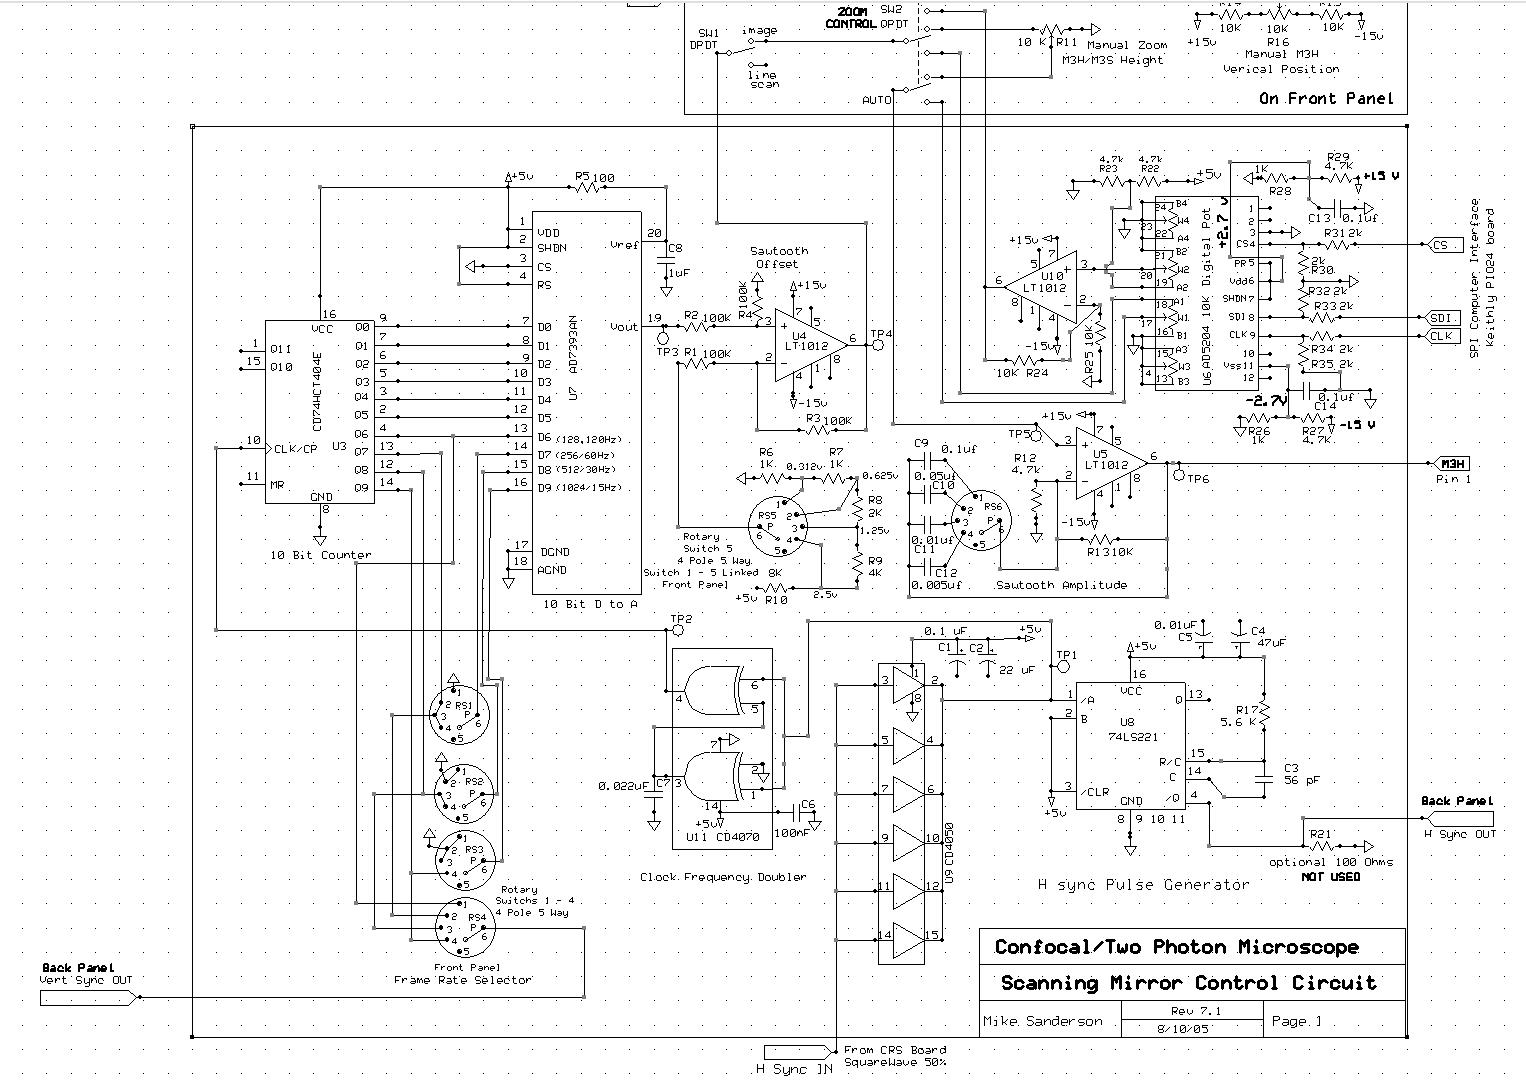
The figures below show the circuit schematic, and the corresponding board layout (word doc.), and the components to populate it are listed here (word doc.).

Circuit Diagram A.
|

Circuit Diagram B.
|
click the individual images to view them at full resolution |
The resonant (x) scan mirror operates autonomously, driven by a circuit board supplied by the manufacturer. The only variable parameter is the scan amplitude, controlled by a voltage between 0 and +5 V as set by potentiometer R11. The mirror vibrates at about 9 kHz, and for each cycle the driver board generates a sync pulse (H Sync IN). This is ‘cleaned up’ by CD4050, frequency-doubled by CD4070 (because we capture 2 lines – forward and backward scan- for each mirror cycle), and fed into the clock input of a binary ripple counter (CD74HCT404E). The output lines of the ripple counter are then used to drive a 10 bit digital to analogue converter (AD7393AN), thus generating a linear ramp waveform to drive the vertical (y) scan mirror. (NOTE the DAC chip is difficult to buy in small quantities, but you can request free samples from Analog Devices. They now supply it only in a surface mount – not DIP – package. The custom board layout is designed for surface mounting this chip, but requires some careful soldering).The digital lines go through a rotary switch (RS), so that the ramp generator resets to zero (i.e. starts a new frame) after either 128, 256, 512, or 1024 counts (scan lines); corresponding to frame rates of 120, 60, 30 and 15 Hz at increasingly high vertical resolutions. The rotary switch also selects the appropriate digital line (rising edge every 126, 256, 512 or 1024 counts) to output as a vertical sync signal to the computer acquisition board. The ramp output from the DAC passes through two op-amps, that center the ramp waveform around 0 mV (U4) so that the center position of the vertical scan does not change when the magnification is altered, and low-pass filter the signal (U5) to slow the mirror flyback. The final ramp waveform (pin 1) connects to the + input on the mini-sax driver board that runs the M3H vertical scan mirror. A front panel potentiometer connects via pin 6 to the – input of the min-sax, providing a vertical pan control. The image display on the computer monitor can be top-bottom inverted if desired by reversing the control inputs to the mini-sax board.
Scan mirror circuit boards
The electronics module contains separate driver boards for the CRS (resonant) x scan mirror and the M3S y scan mirror.
CRS driver. Click here for the manufacturers user manual describing the CRS scanner and its driver board.
The CRS scanner will arrive from GSI with two circuit boards. Throw one of these away! (the pixel clock board) – all you need is the driver board itself. The board connects to the scanner via a very short supplied cable. You will probably want to extend this. We cut the cable, and use a 5 pin DIN socket/plug on the back panel and a length of 4 core screened cable to extend. We have had no trouble with cable lengths as long as 10 ft. Power supplies and control signals go through connector J3 on the board. Pinouts are specified in the user manual – use a 16 pin ribbon cable connector to interface. The sync signal exits from pin 8; but make sure that jumper W1 is connected to enable this output (by default it is open). Potentiometer R24 needs to be turned fully clockwise so that the sync signal occurs at the beginning of the scan. Connector J2 is not used. The board generates little heat, but for safety we mount it using a metal block to attach the heatsink to a side panel of the electronics box
Mini-sax driver. Click here for user manual
This board (mini single-axis controller) drives the M3S vertical scan mirror galvanometer. When ordering, make sure to specify that it is tuned for a 30 Hz sawtooth waveform driving an M3S with paddle mirror assembly. Connections are straightforward. Power supplies go in on J1, and control signals (command + and command -) on J2 (other pins not used). The board is supplied with mating connectors.
Connections to the M3S scanner are via two (or 3 if thermal control is specified) non-standard connectors. However, the supplied cables are long, and we have not needed to extend them. For simplicity, we mount the mini-sax board at the back of the electronics module box, with the board connectors facing a cut-out in the back panel. Cables from the M3S can then be plugged directly into the mini-sax board. Mount the board with the heatsink bolted to the metal enclosure.
Power supplies
Just 2 power supplies are needed: one for +/- 15 V and one for +/- 5 V. Those listed in the parts inventory are fine – but you could use switching supplies for a smaller package and lighter weight. Jumper the inputs to the transformers as specified on the manufacturers data sheets for your voltage (110 or 240 V); route the AC power via a front-pane on/off switch; use a fused AC power connector on the back panel; and use heat-shrink sleeving to cover all exposed AC connections.
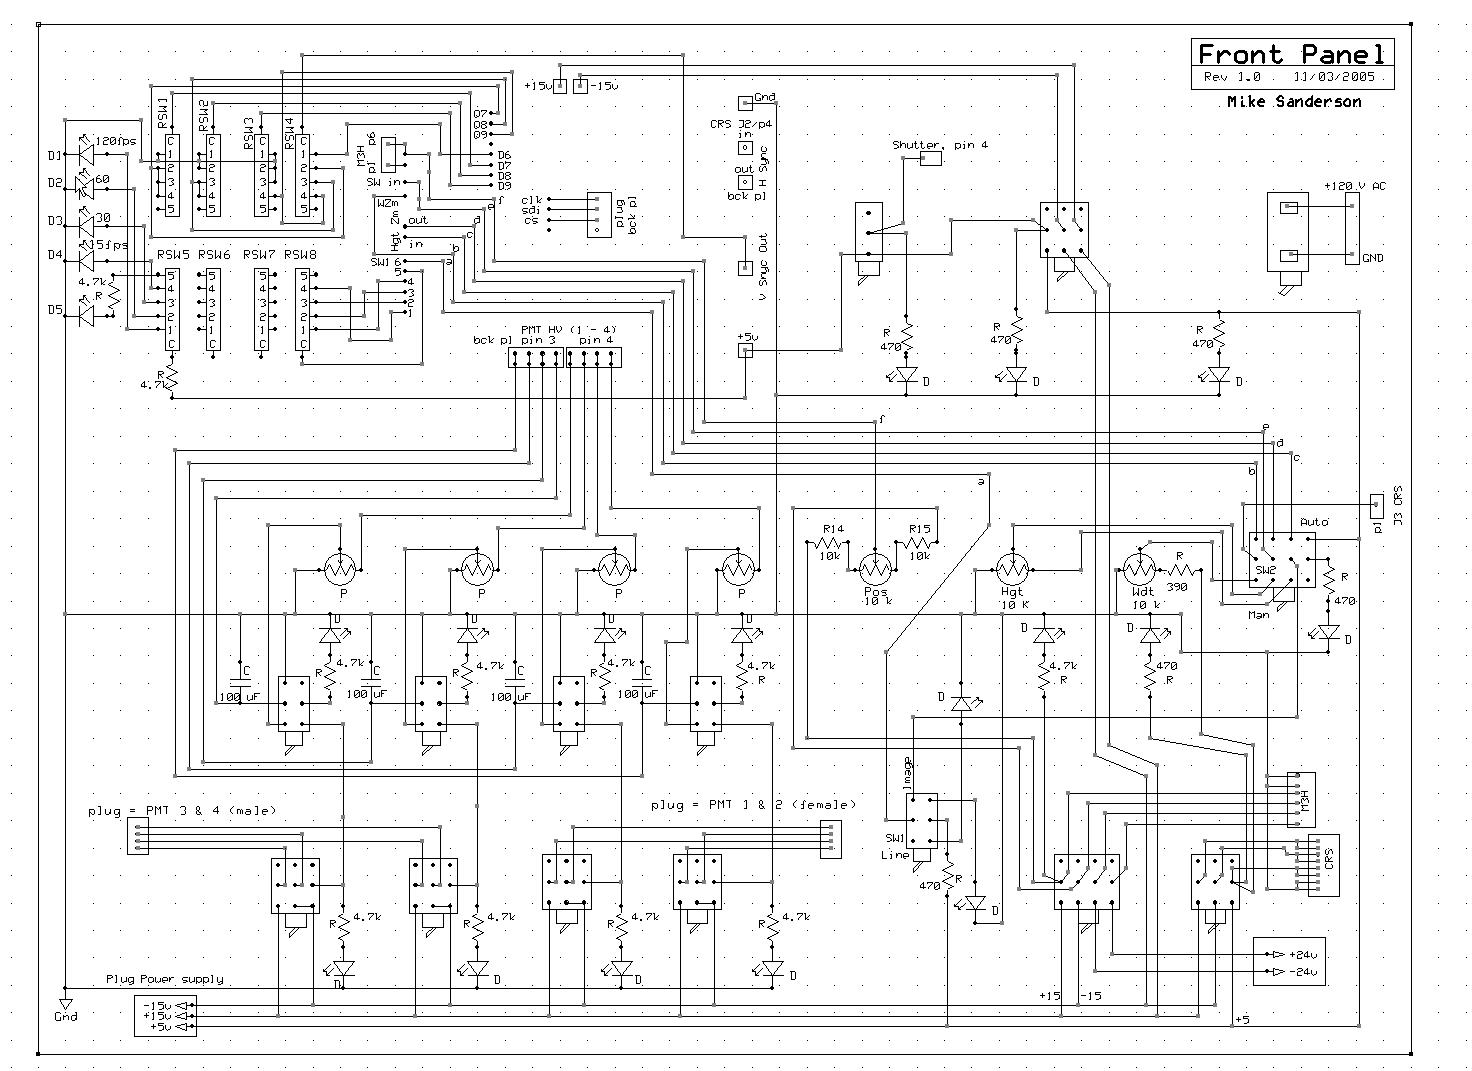
Front panel
The front panel mounts all controls (switches, potentiometers). The schematic looks complicated (image below), but in fact is fairly simple. In addition to the various switches and potentiometers that connect to the main pcb, the major components are the potentiometers to control the PMT gains. One is needed for each pmt (the schematic shows a 4-channel design). To operate the Electron Tubes P30 modules a control voltage of zero to +1.85 V is needed, which can be obtained from the +5 V power supply using a 10K ohm 10-turn potentiometer in series with a 15 k ohm resistor. Fit the potentiometers with digital read-out dials so as to be able to obtain reproducible gains. The voltage to each potentiometer is controlled by a separate switch, and colored LEDs indicate when each PMT is powered. Also, a master switch allows power to all PMTs to be cut off (useful when turning on the room lights, as the PMTs should not be exposed to bright light when operating).
 Front Panel Schematic
click on the image to view it at full resolution
Front Panel Schematic
click on the image to view it at full resolution |
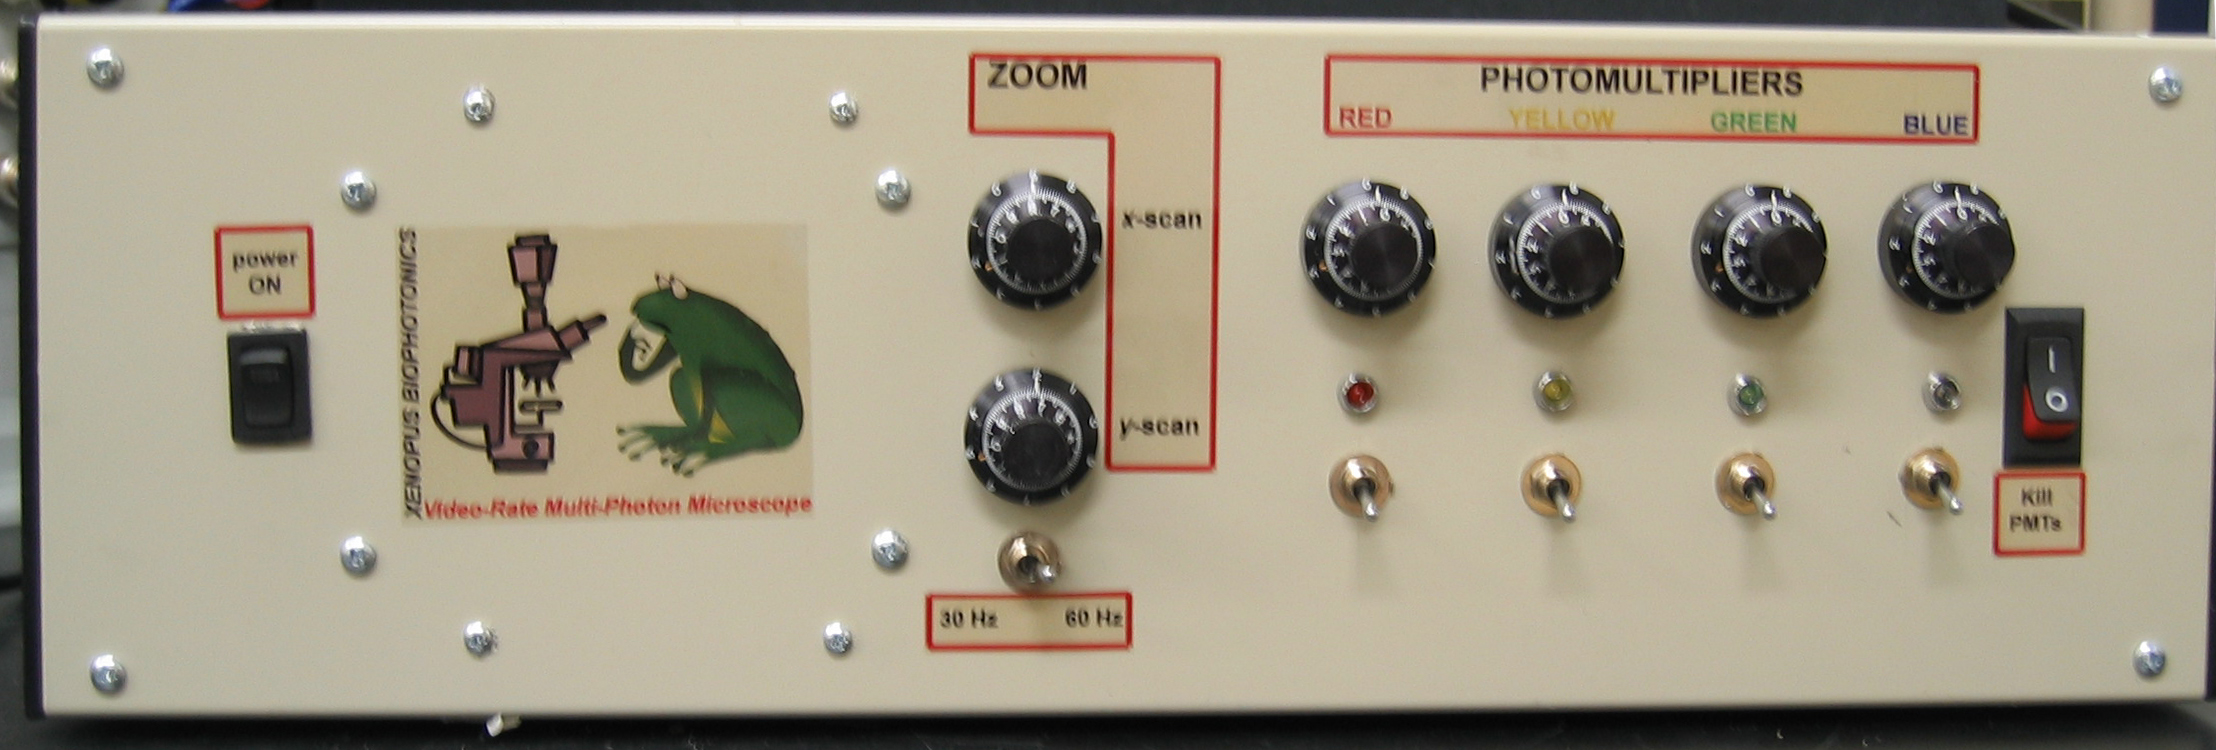
The layout of the controls can be varied as to individual aesthetic/ergonomic requirements. A layout we have used is shown below.
 Control Panel from 2P-2G
click on the image to view it at full resolution
Control Panel from 2P-2G
click on the image to view it at full resolution |
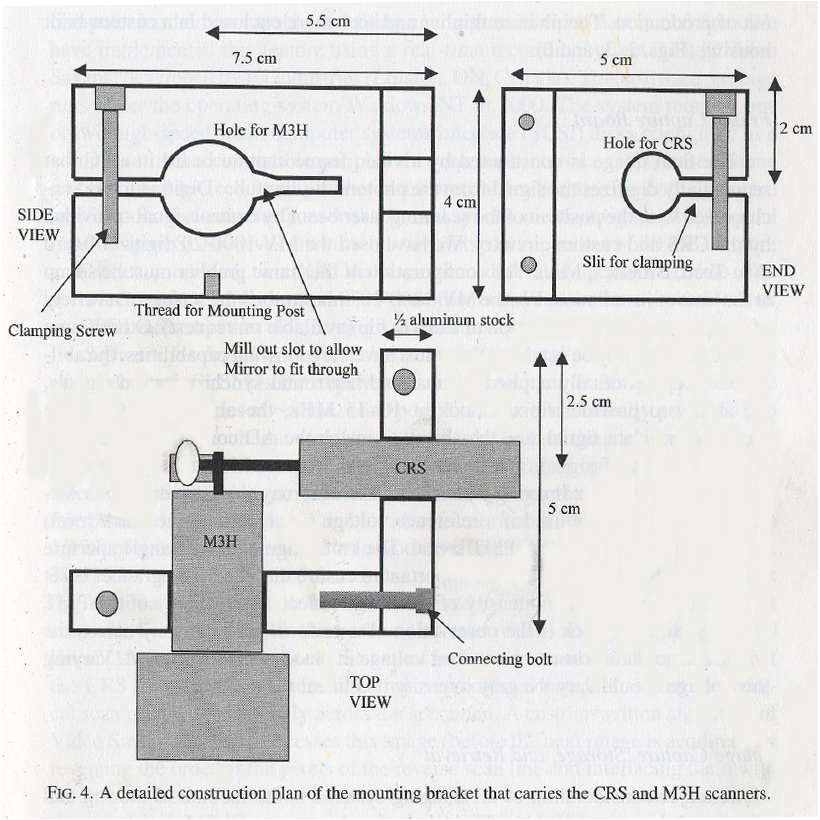
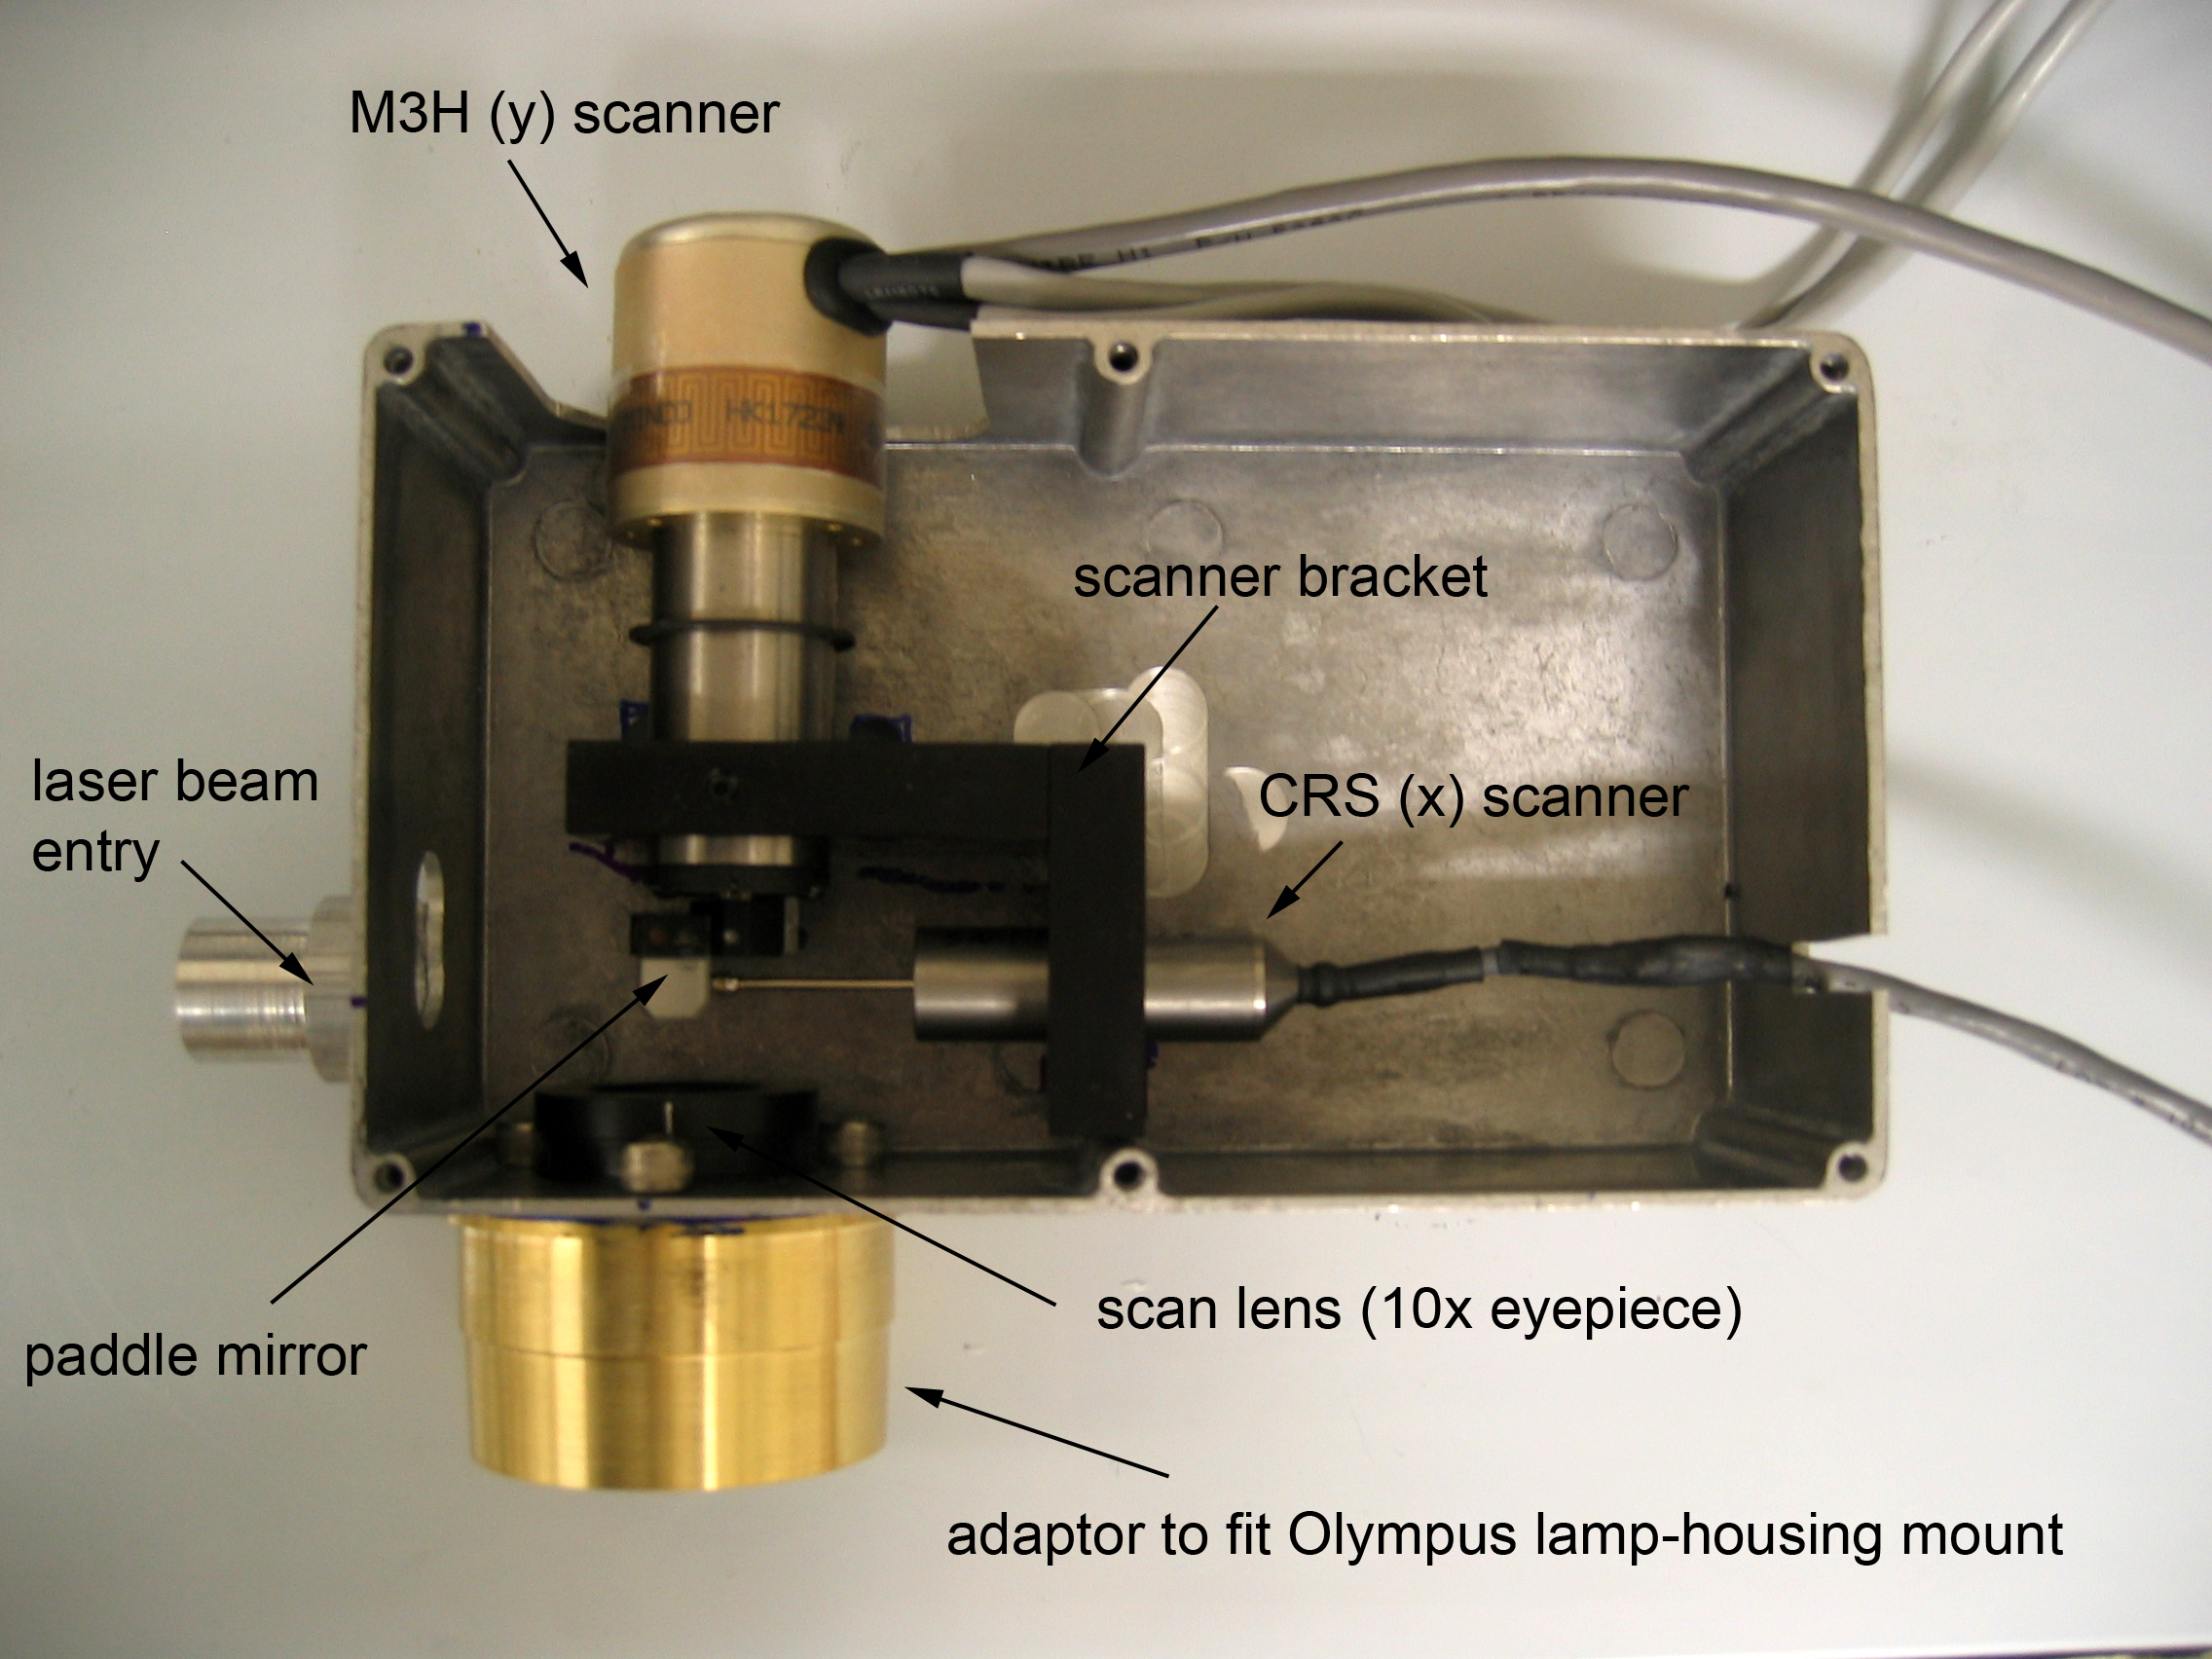
|
The scan head is a metal box, containing the mounting bracket holding the CRS and M3S scanners, and a microscope ocular (Olympus 10x widefield) that serves as the scan lens.
 A detailed construction plan of the mounting bracket.
|

Scan head (annotated) |
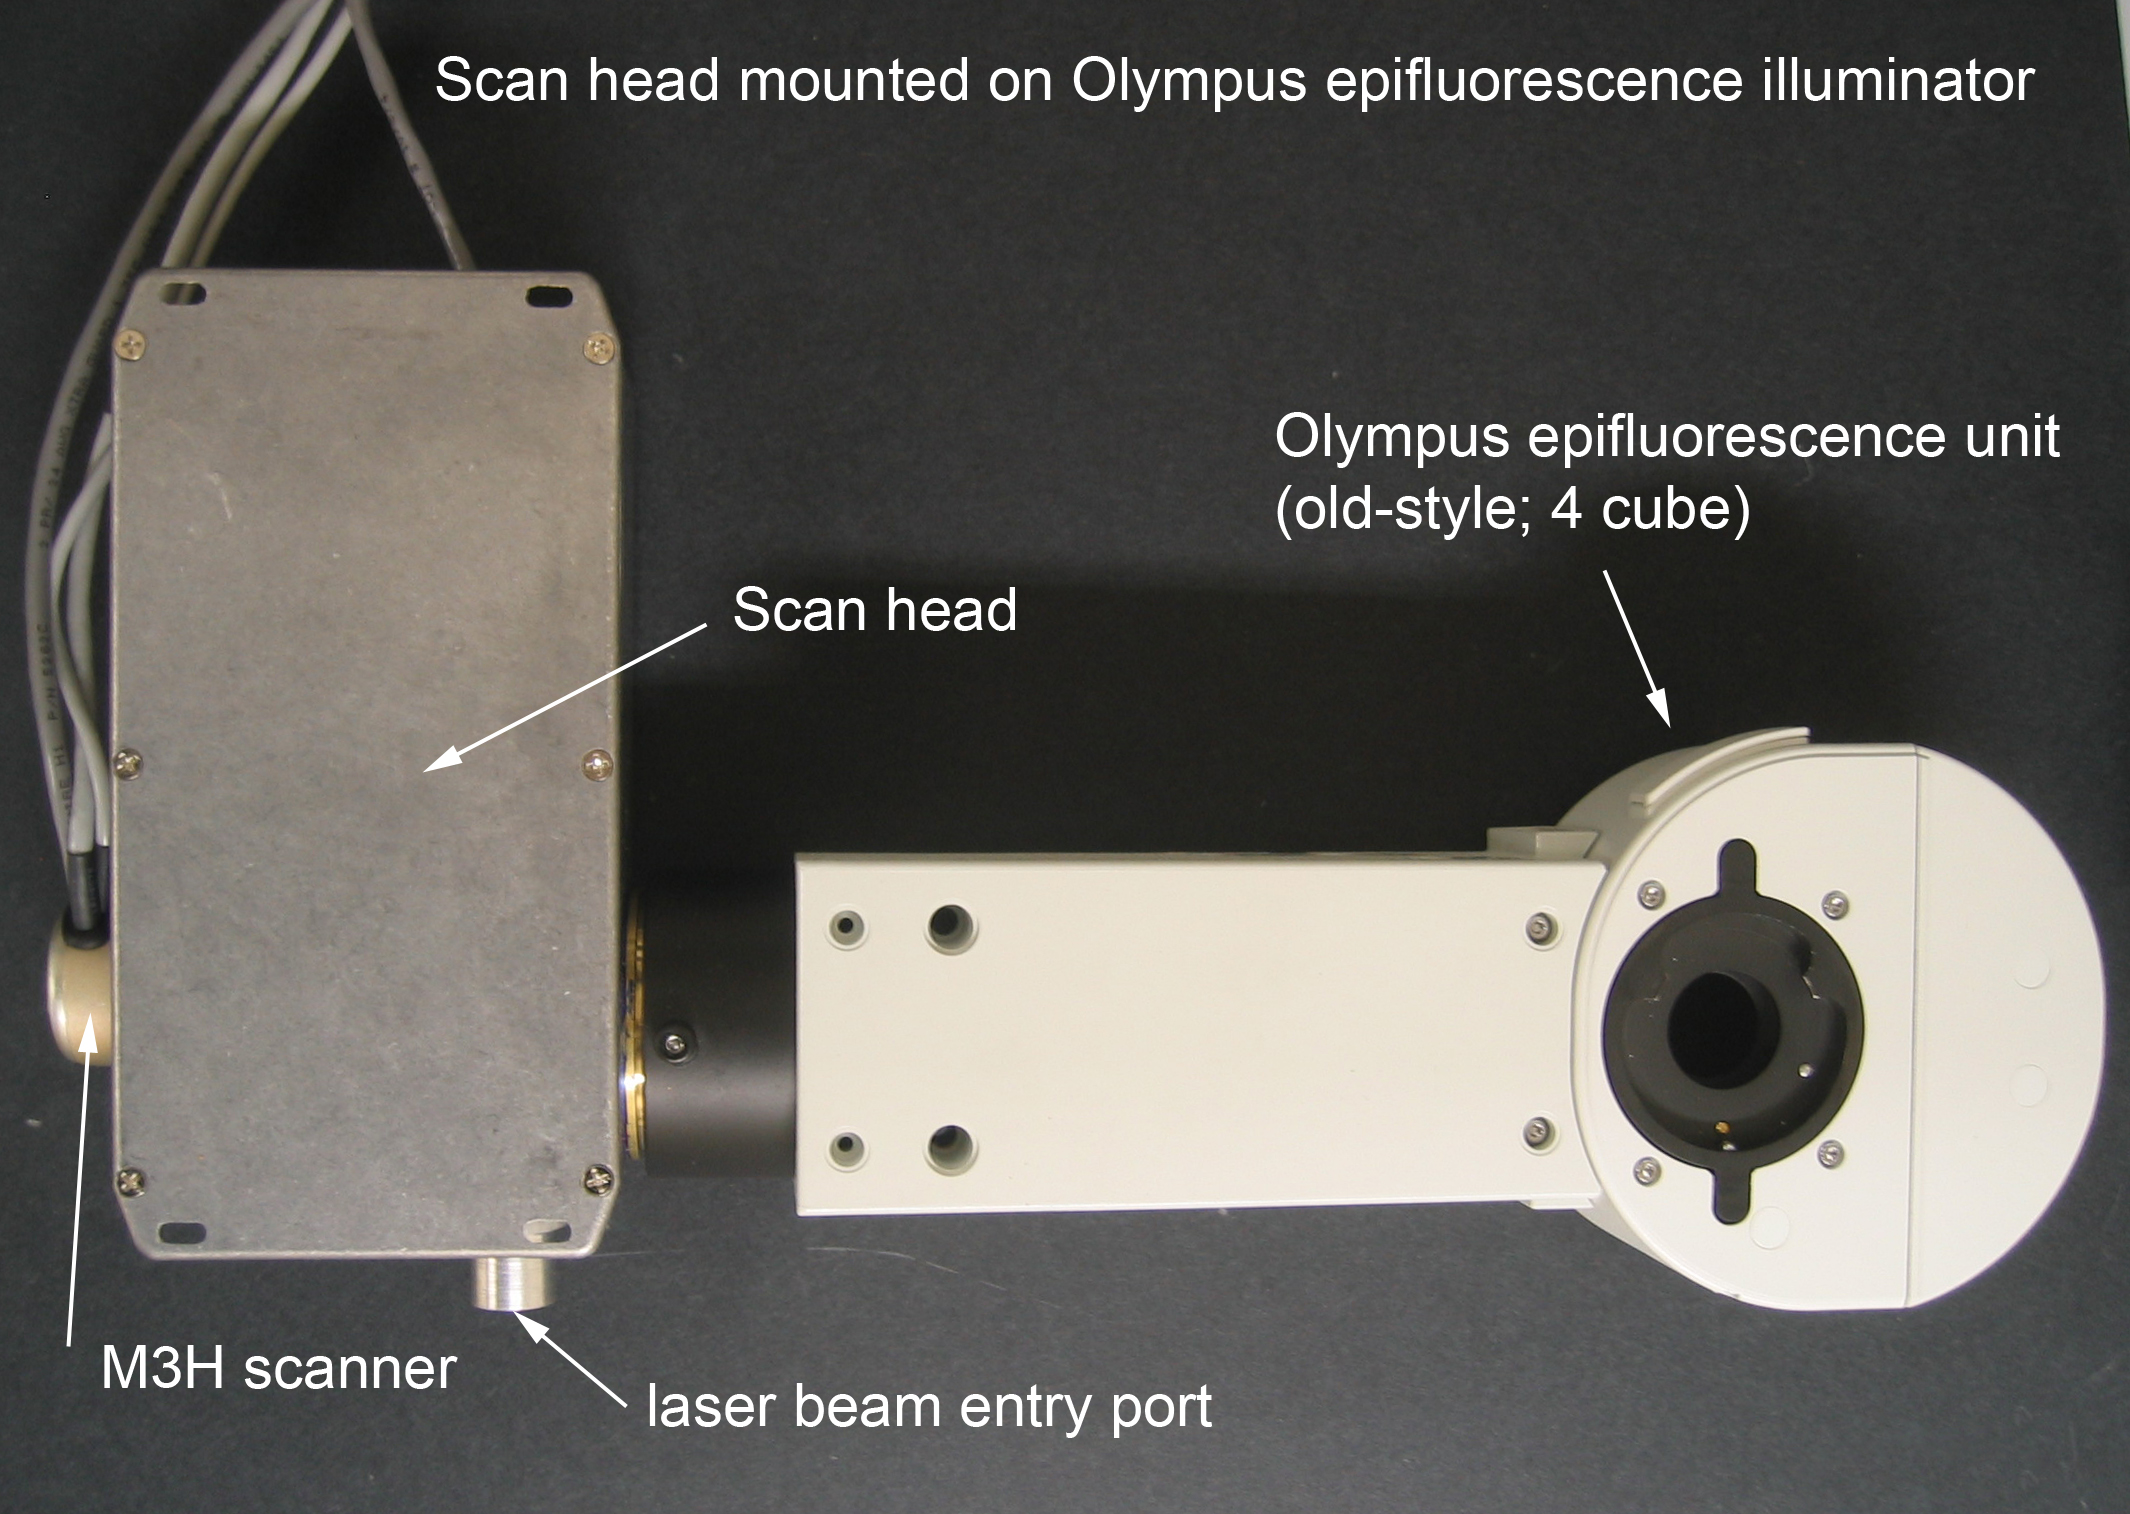
 Scan epifluo module |
click the individual images to view them at full resolution |
The box is fitted with an adaptor that allows it to be mounted on the rear port of a modified Olympus reflected light unit. The scan lens can be adjusted along the optical axis to ensure that the scan mirrors (or at least, a point between the two mirrors) is focused at a telecentric plane of the microscope.
The reflected light unit (old-style Olympus 5-UR500) is modified by removing ALL internal optics (lenses at rear and front, shutter, aperture and field diaphragms), and machining out the front lens mount (inside the metal block that mounts onto the cube turret) to accept a 1 inch IR-transmission-coated achromatic doublet (f = 150 mm) that serves as a tube lens.
|
|
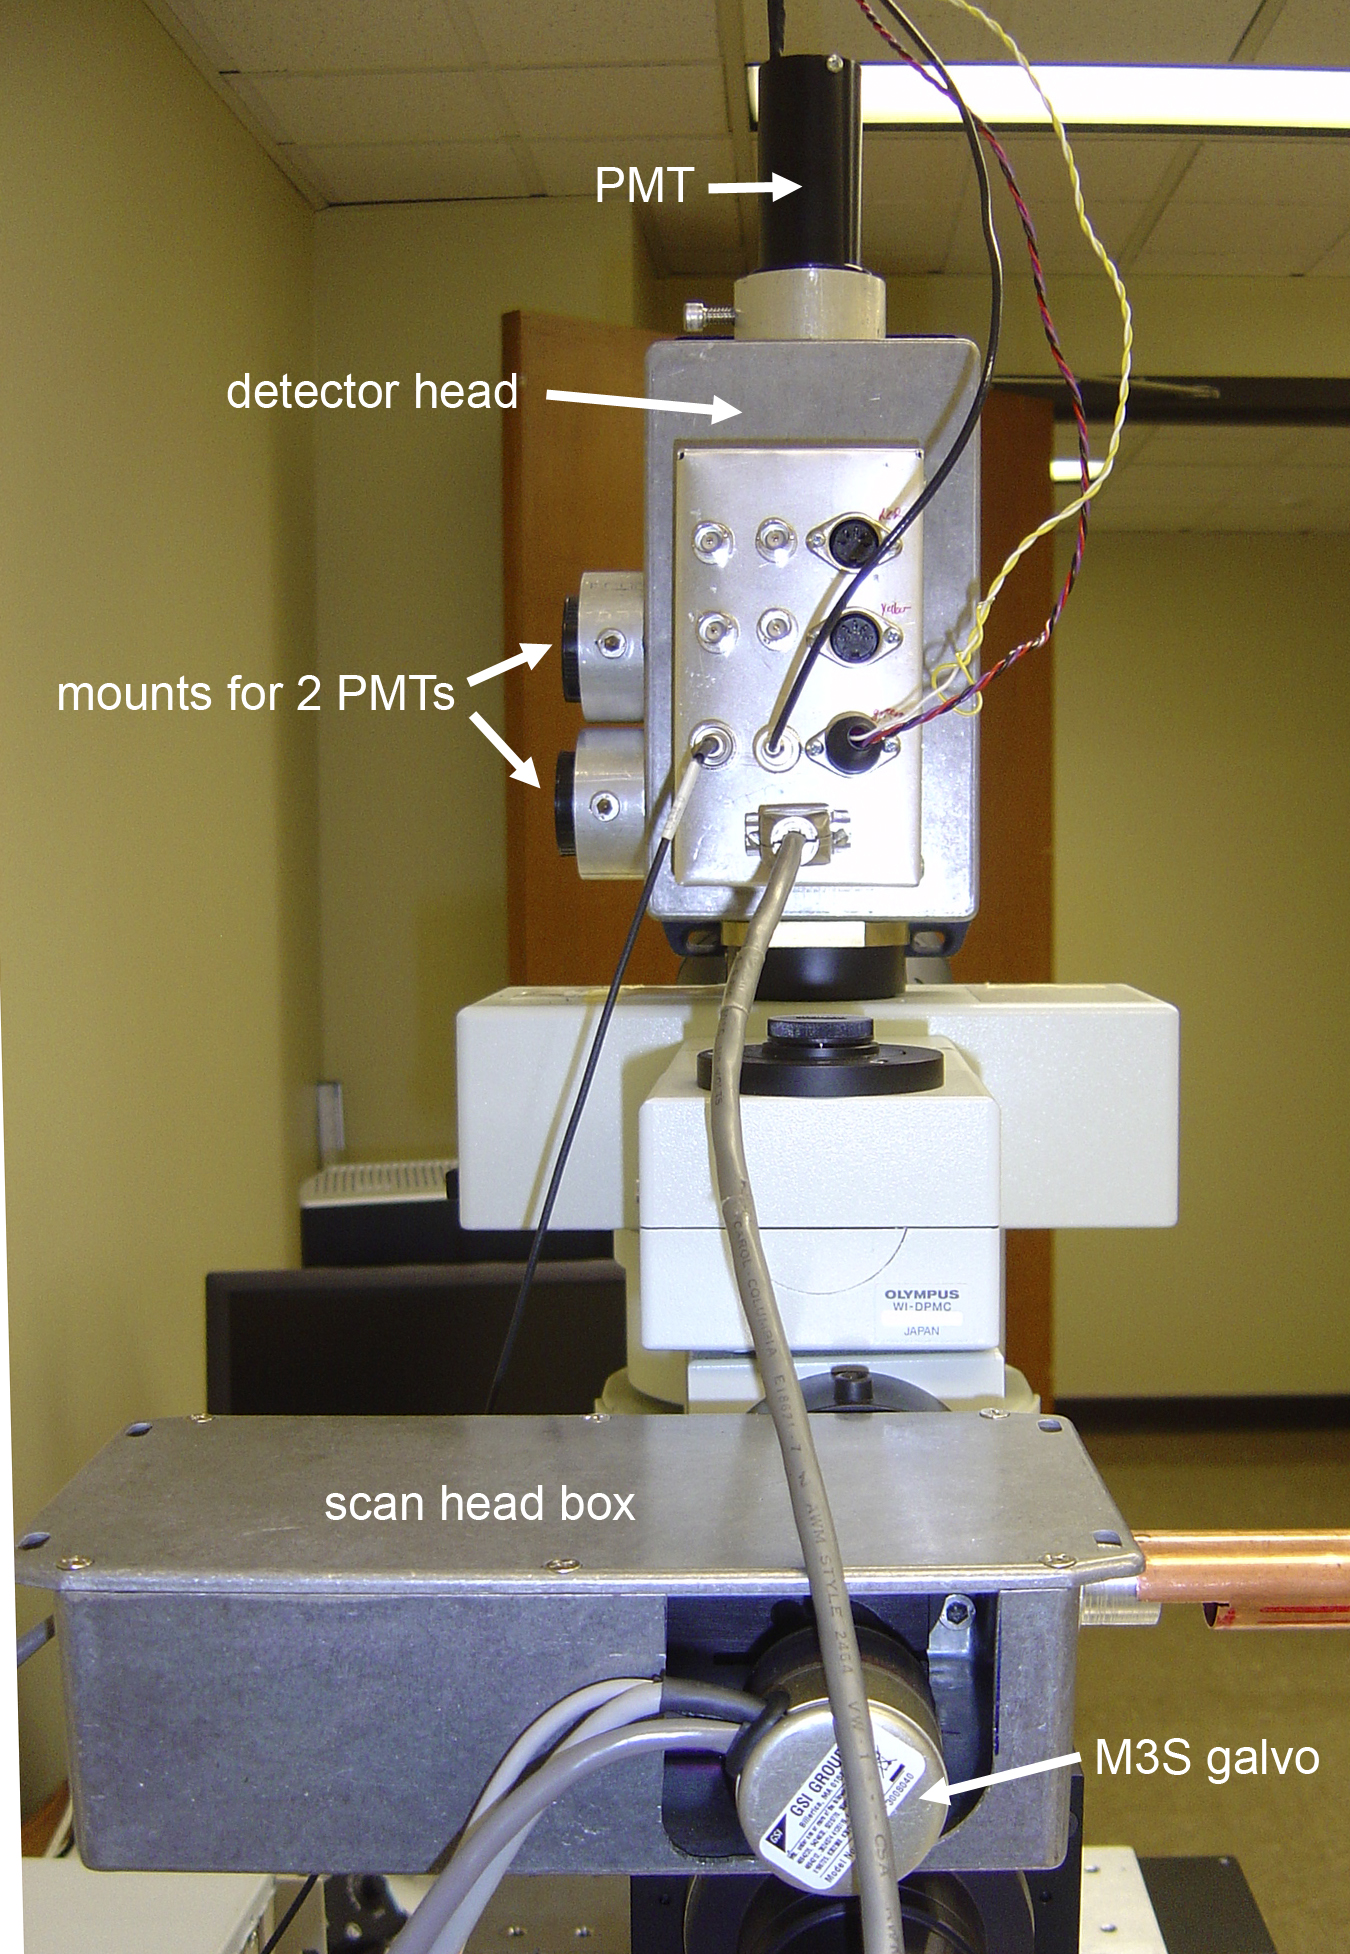
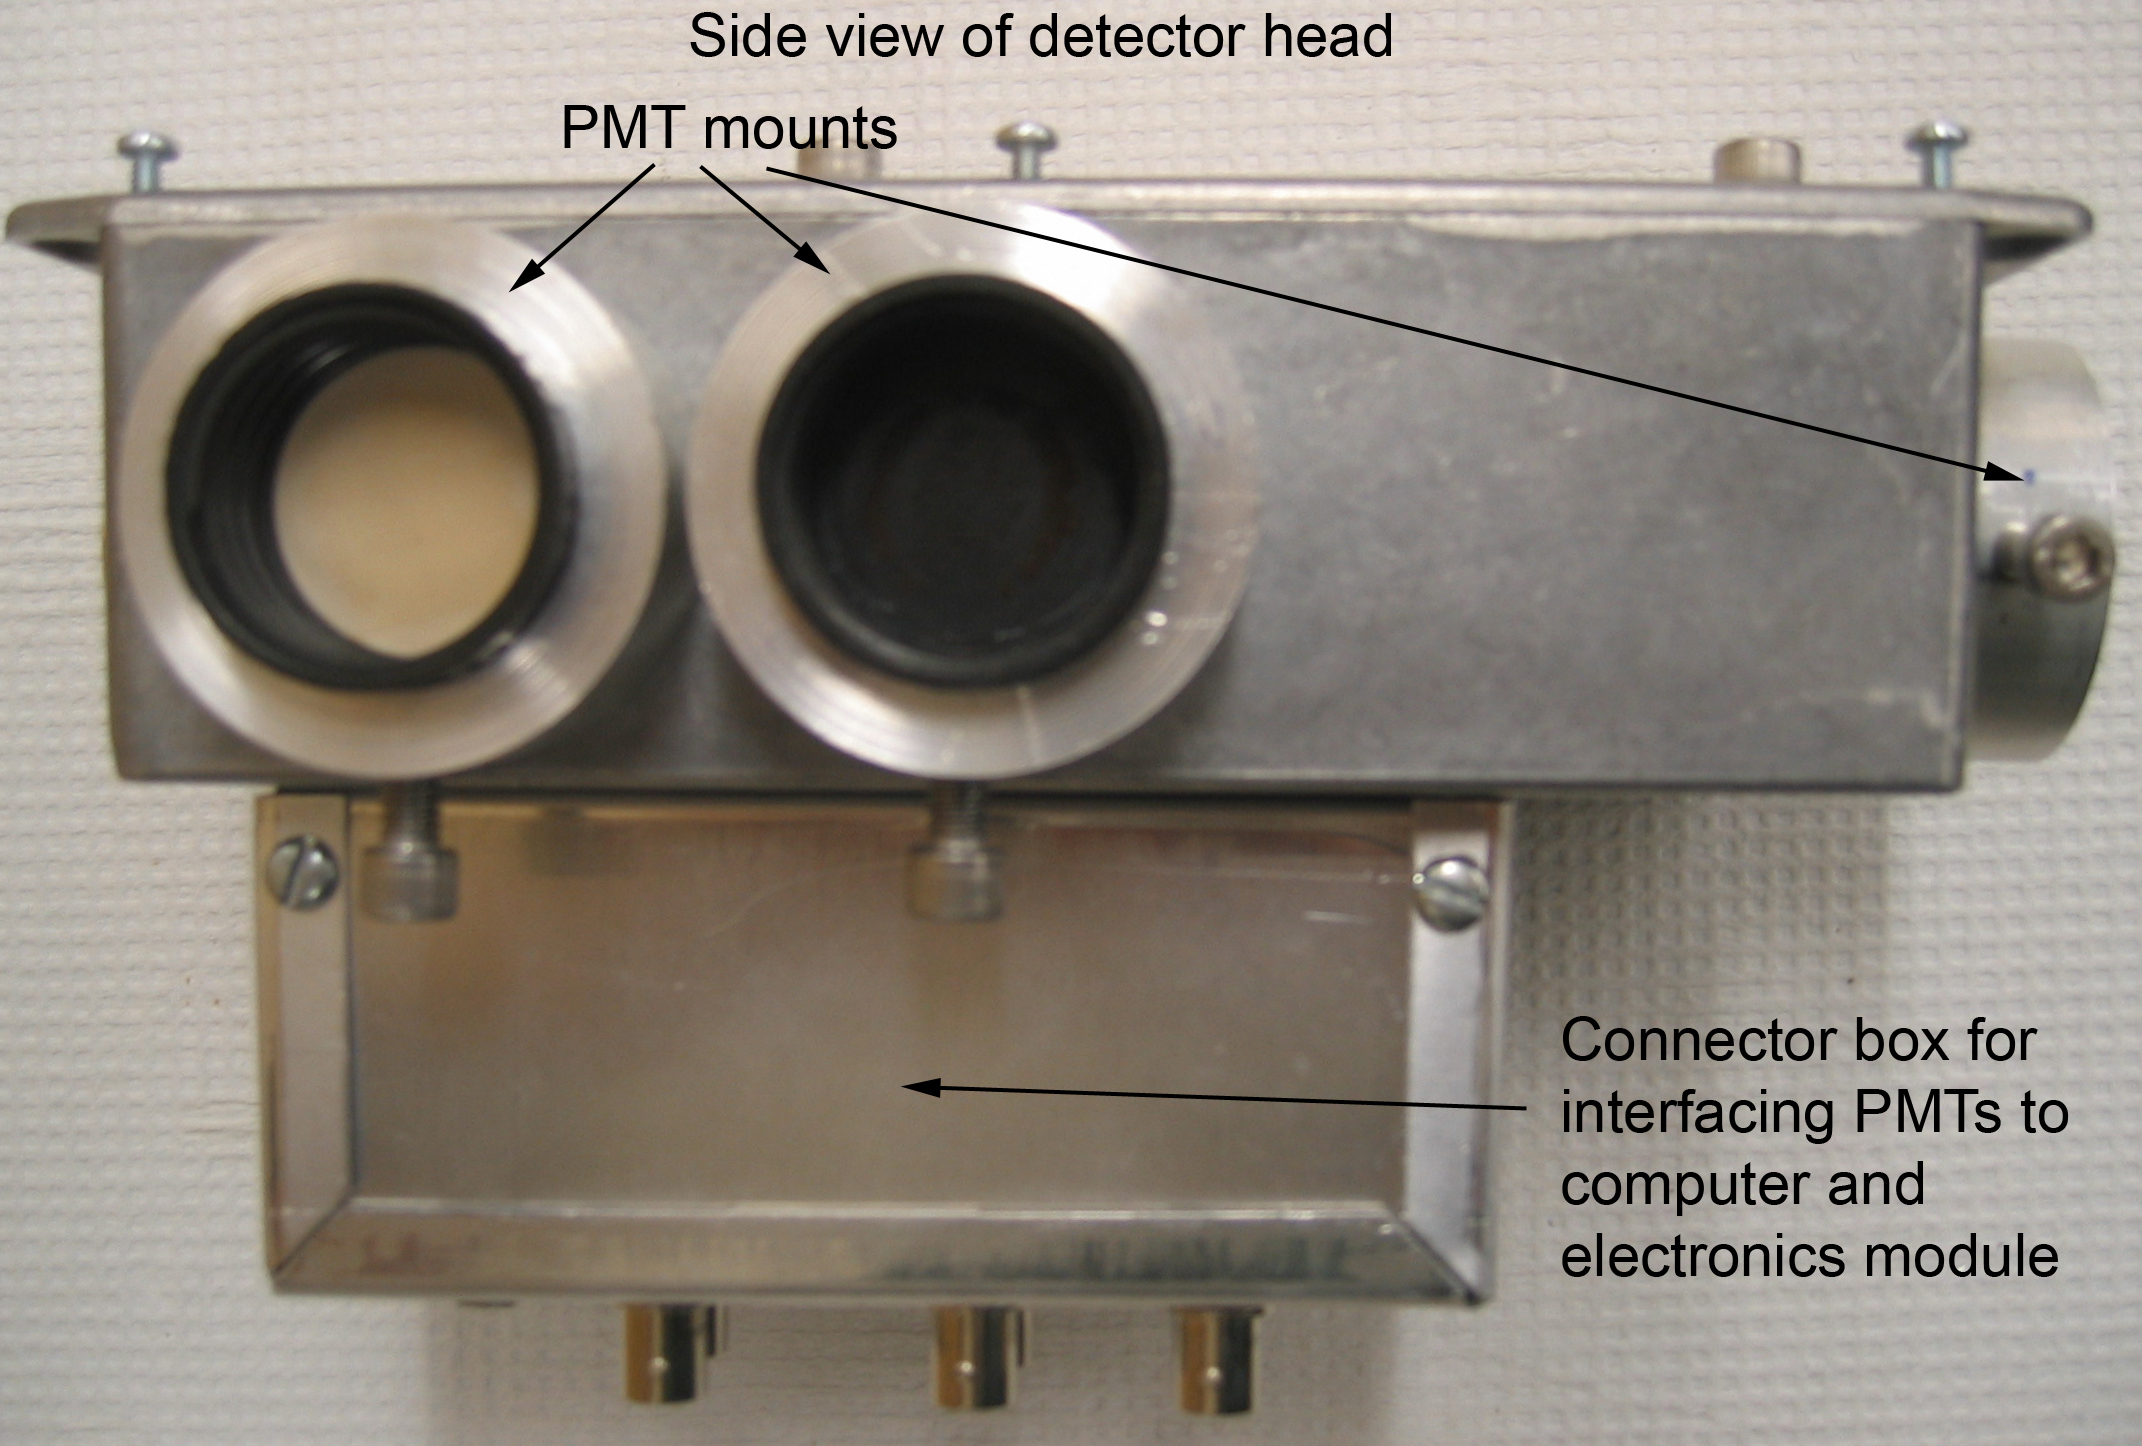
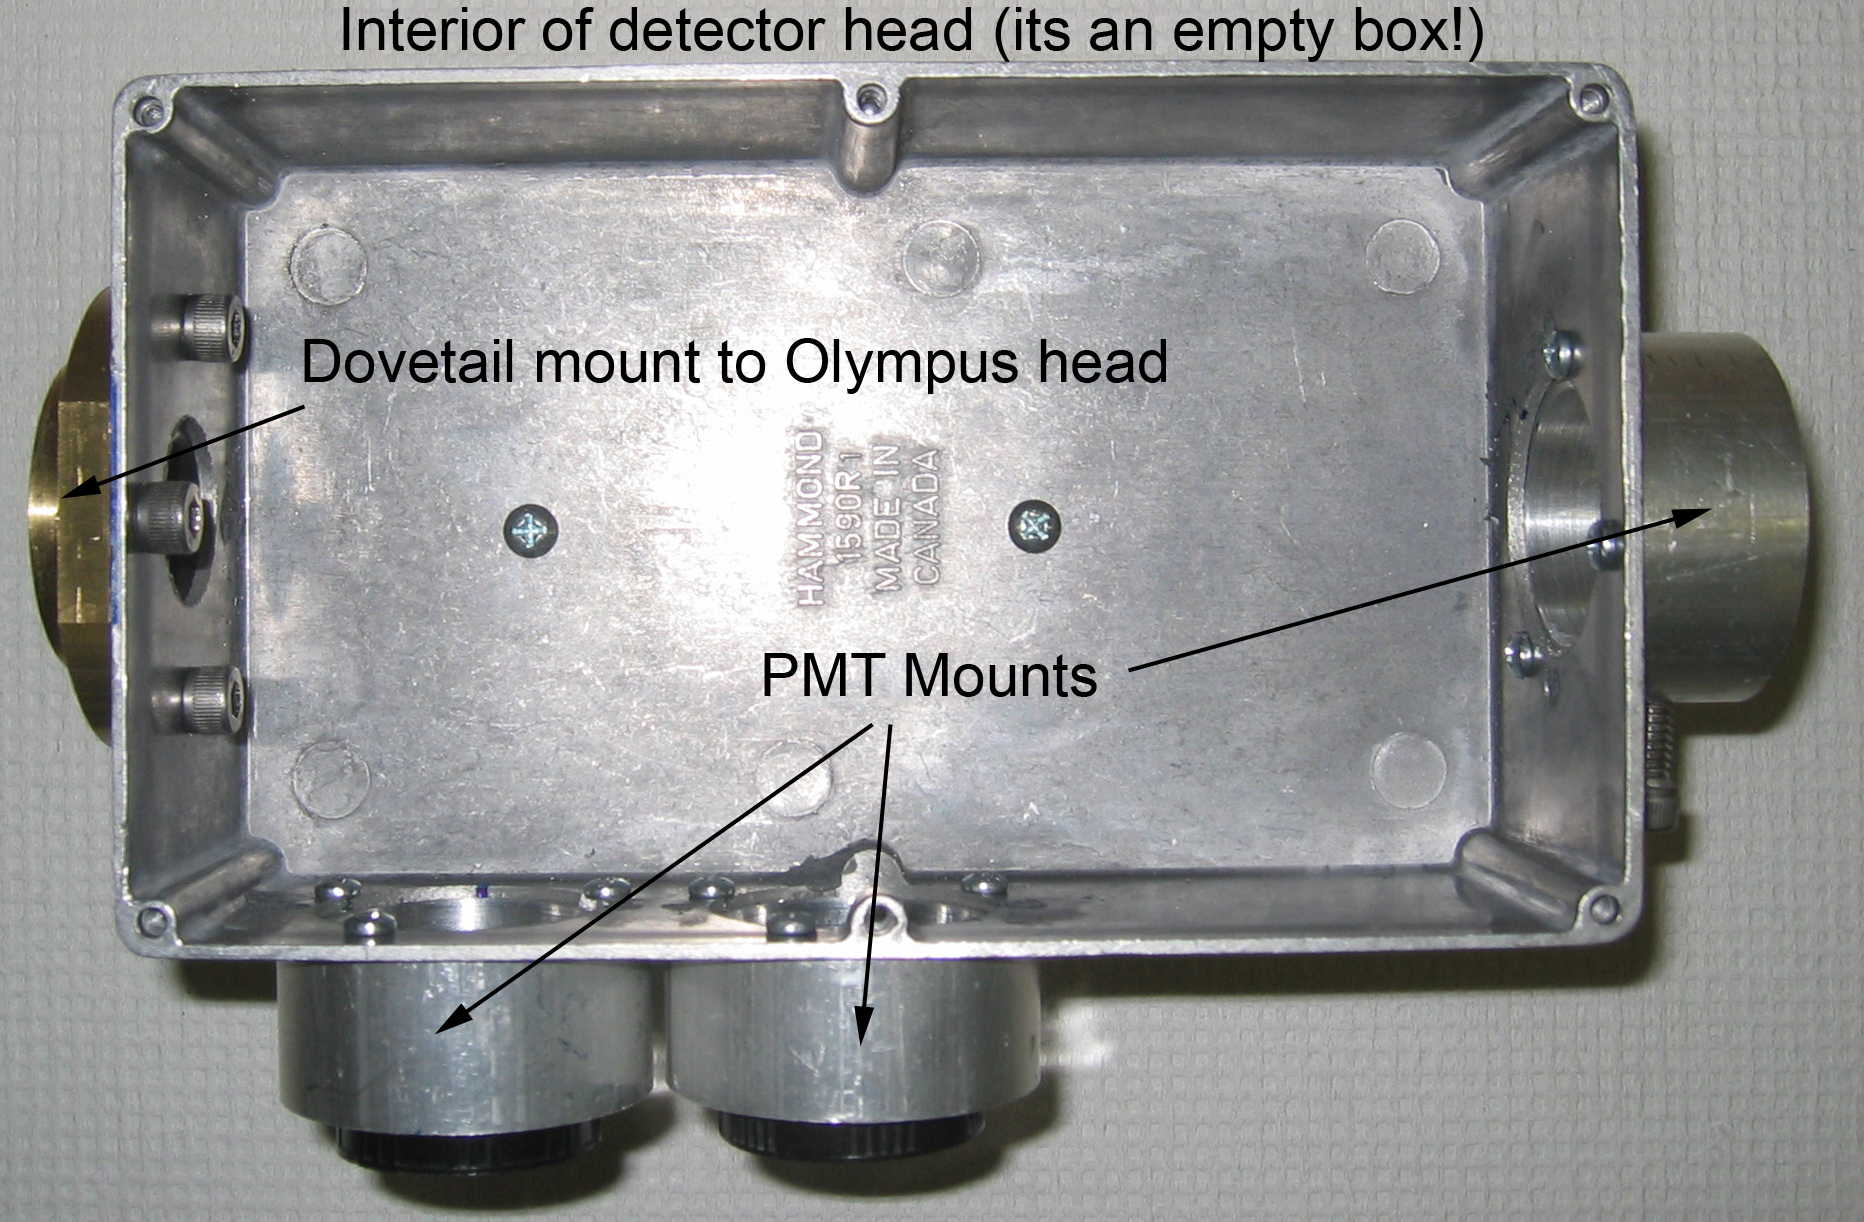
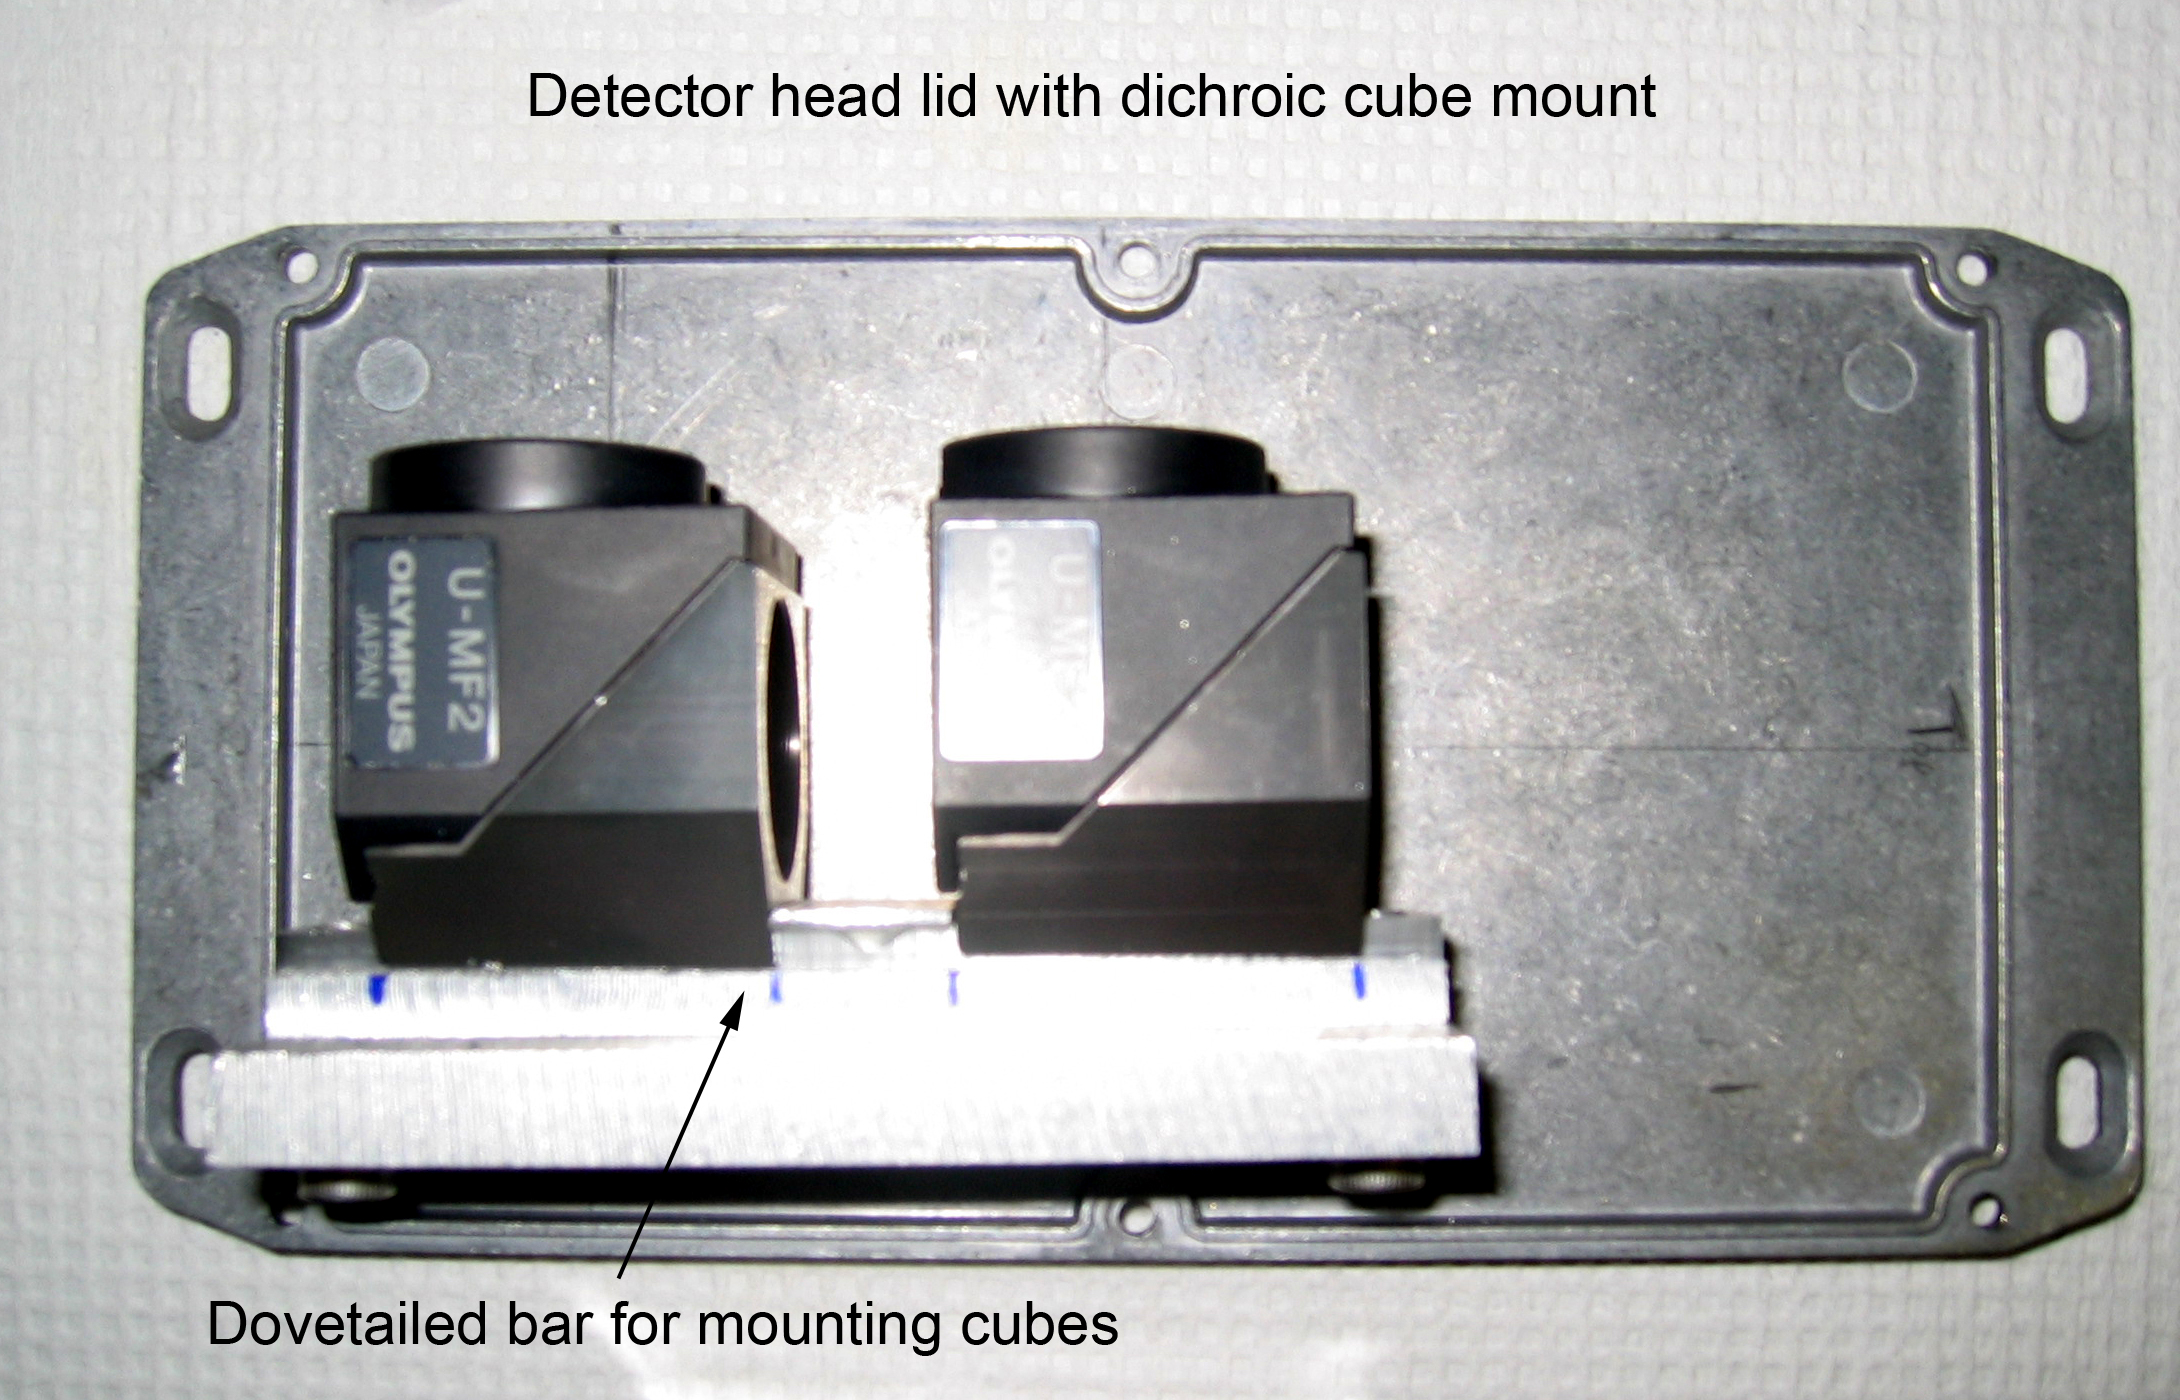
The detector head simply comprises a light-tight box holding cubes with appropriate dichroics for selecting wavelengths along with mounts for the photomultiplier modules. For convenience, we make the detector head using a die-cast metal box (e.g. Allied Electronics part#806-1985). Attached to this is a custom-machined dovetail to mount onto a standard Olympus mount, and three holders for the photomultiplier modules. A custom dovetail rail mounted on the lid of the box holds two Olympus cubes, permitting the emitted fluorescence light to be split into three wavelength bands and directed onto three photomultipliers. An infrared blocking filter (Chroma, e650sp-2p) is placed at the entry to the detector head to ensure that laser light is well blocked. We use an O-ring to secure the filter in a 1 inch hole machined in the Olympus dovetail mount.

Side view of detector head |

Detector head interior |

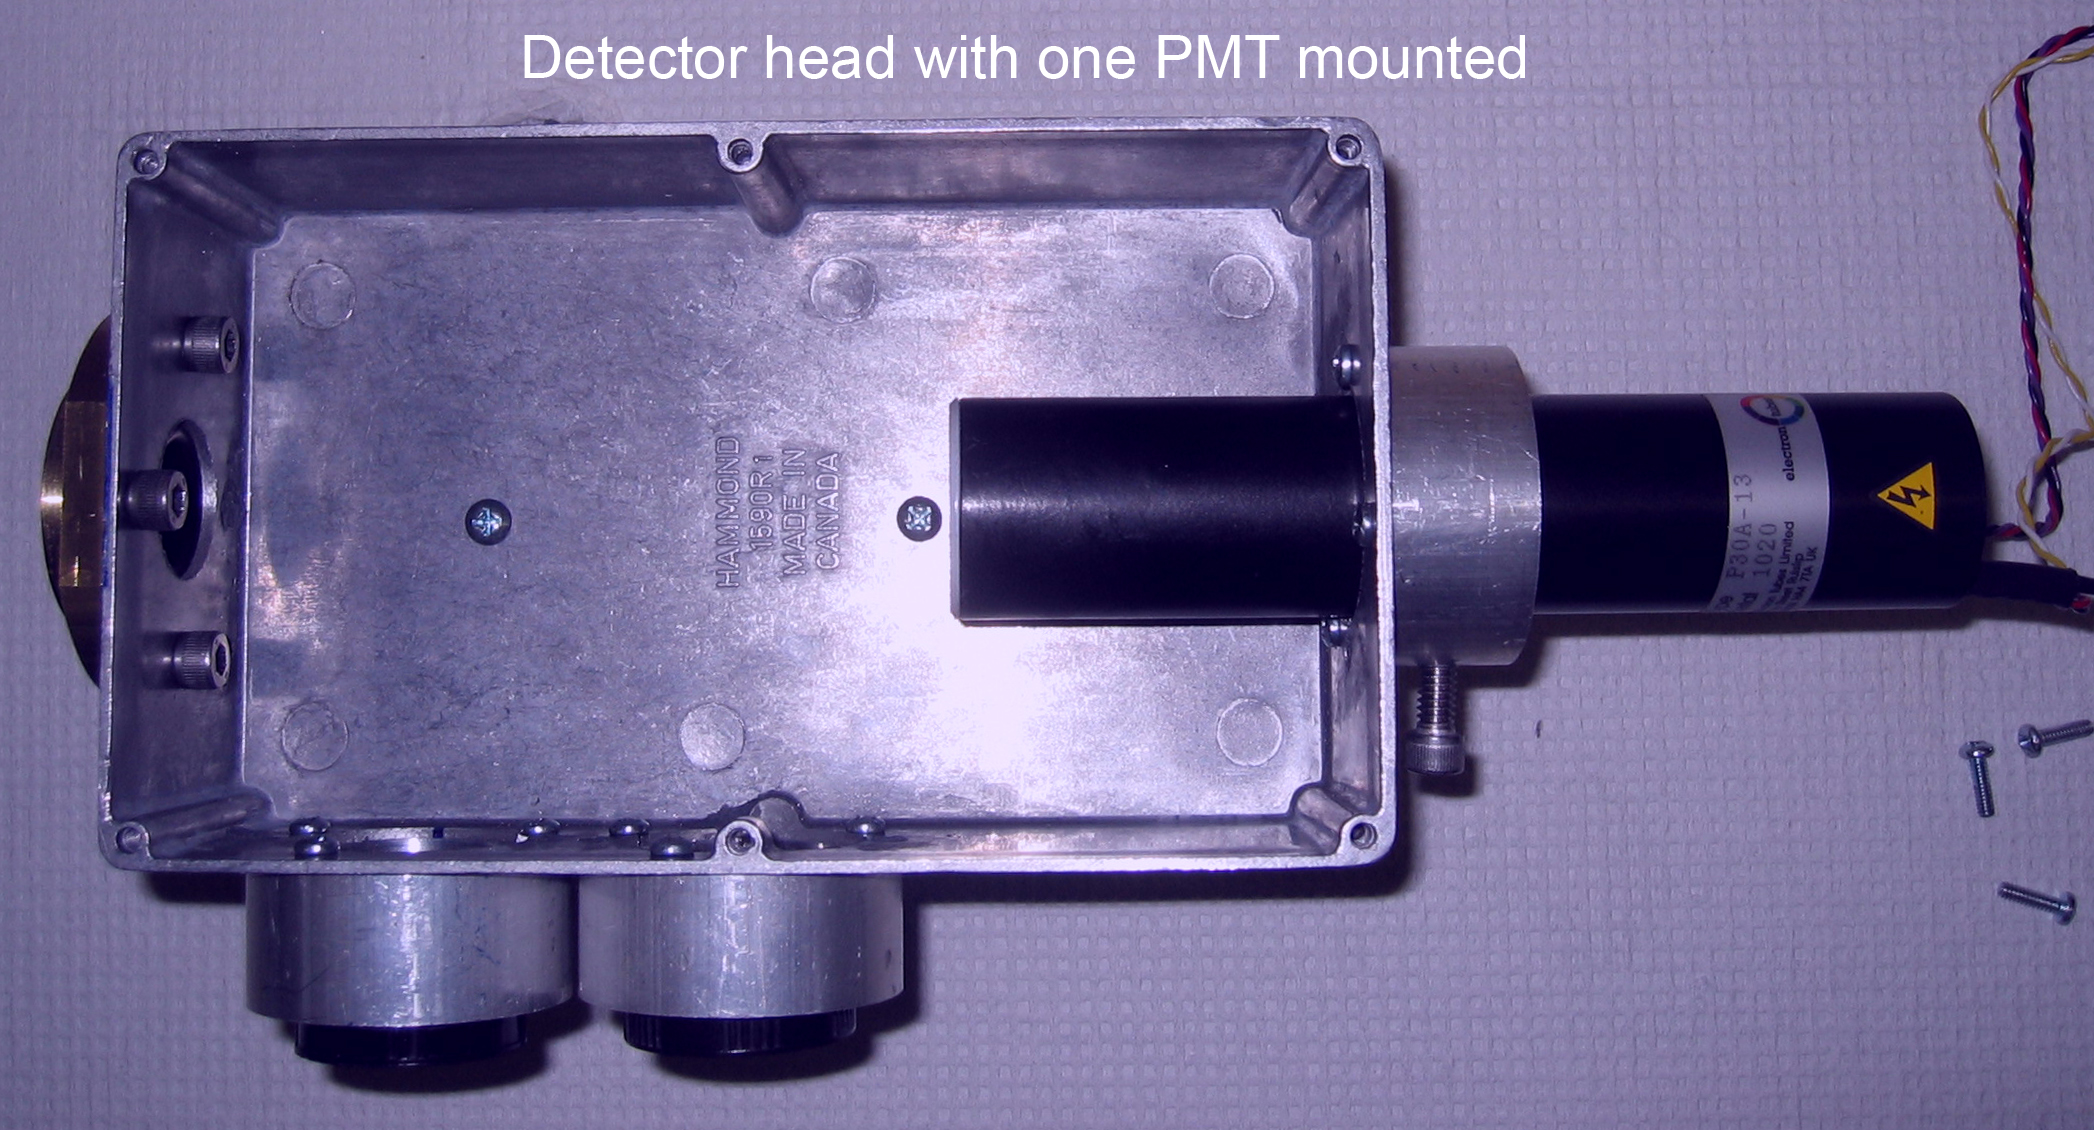
Detector head with one PMT |

Detector head lid |
click on the individual images to view them at full resolution
A typical arrangement might employ dichroic filters transmitting at wavelengths >510 and > 560 nm to provide ‘blue’, ‘green’ and ‘red’ signals from the photomultipliers. For many applications (eg. visualizing cell types stained with blue-, green- and red-emitting dyes) we do not use any bandpass filters to further select the detection wavelengths, preferring to maximize light collection efficiency at the cost of bleed-through between channels. Appropriate filters can, however, be mounted in the cubes as needed.
We use P30 series photomultiplier modules from Electron Tubes for detection of emitted fluorescence. These are highly convenient, containing a photomultiplier tube, high voltage supply and amplifier all in one cylindrical package. All that is required is to provide a +/- 5V power supply, and a control voltage (0.3 – 1.8V) to adjust the high voltage (photomultiplier gain). We terminate the lead from each module with a 5 pin DIN plug, which connects via a small daughter box on the detector module to a cable (9 pin sub D connector) supplying power and control voltages from the electronics module. The built-in amplifier is specified to drive into a 50 ohm load with >20 MHz bandwidth, and is connected directly (via BNC sockets) to the BNC camera inputs on the cable supplied with the Raven board. To assist in blocking stray light, two O-rings are fitted around each photomultiplier module and are pressed up against the inside and outside surfaces of the mounting rings.
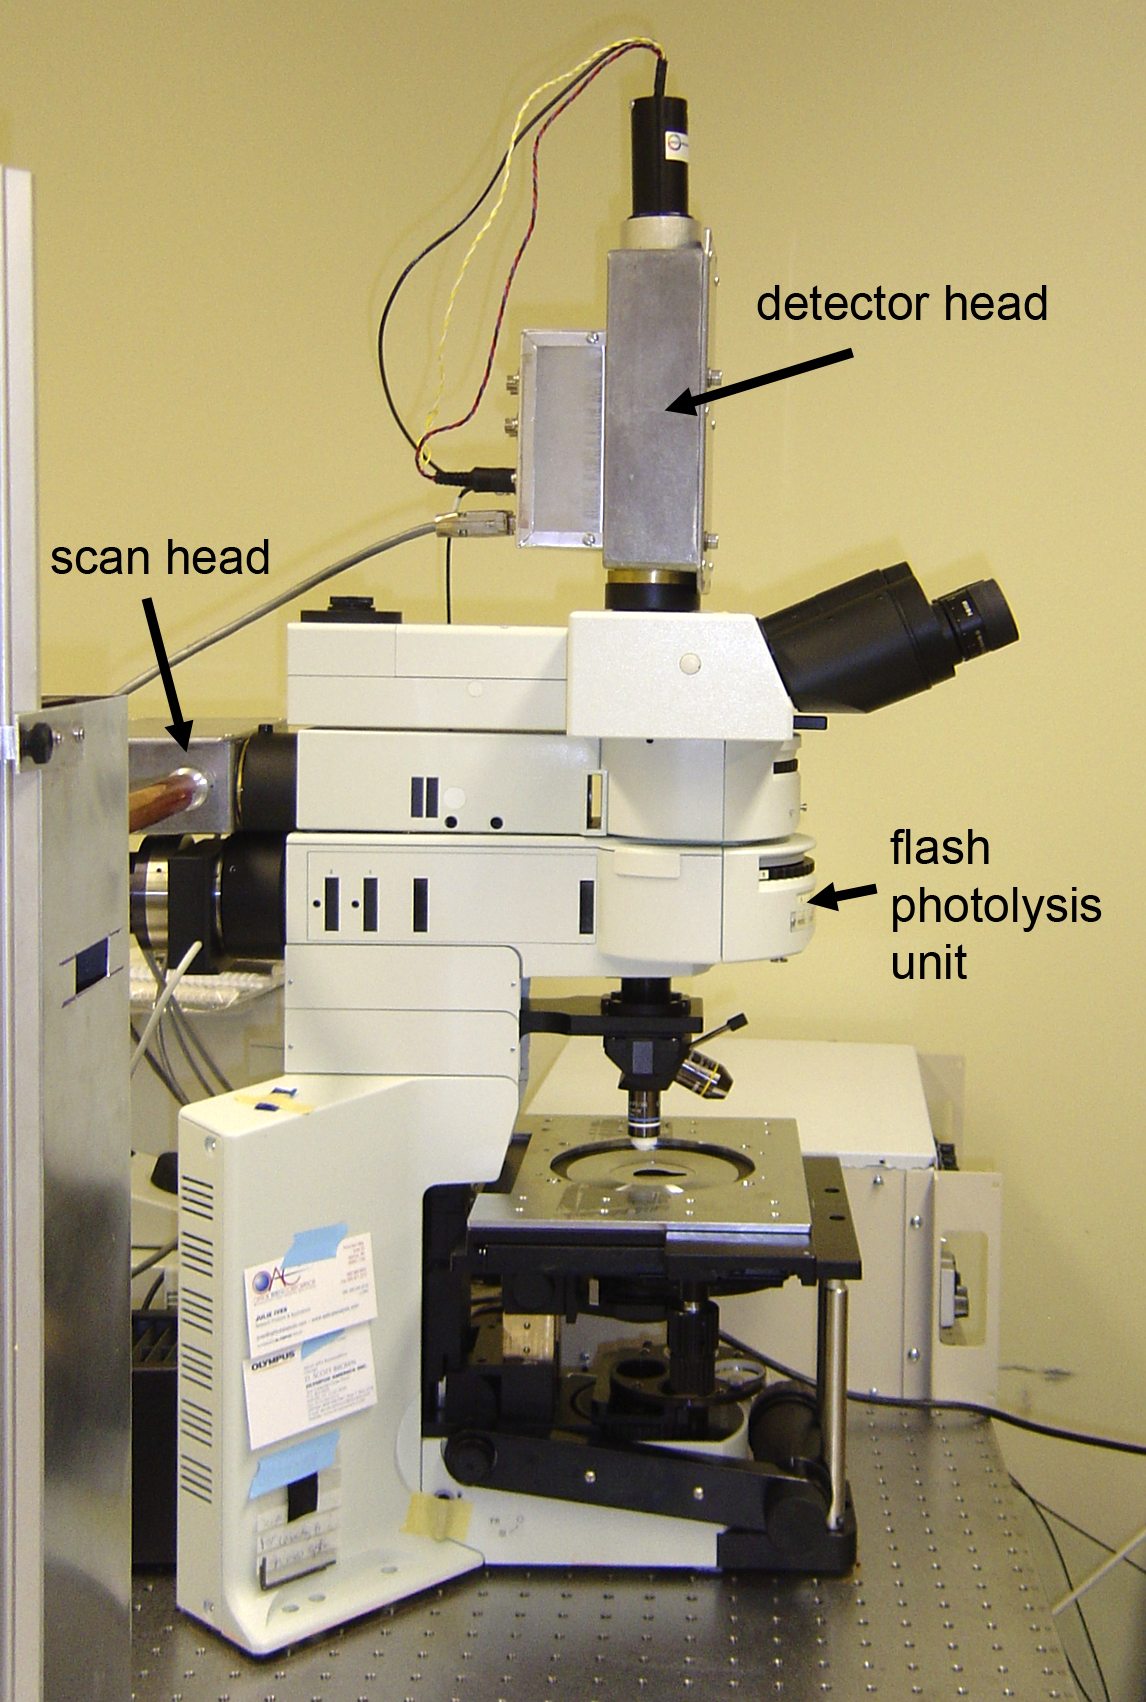
NOTE – The design described here mounts the detector head on the camera port of the microscope trinocular head. This is mechanically convenient, and was necessitated because this system incorporates a second reflected light illuminator used for UV flash photolysis. However, it is not optimum from an optical perspective because scattered fluorescence light from the specimen will not be well collimated by the objective lens, and may thus be lost by vignetting as the photomultipliers are mounted at some distance from the objective. Better light collection efficiency can be achieved by mounting the detector head as close as possible to the objective lens, as in designs for Mark Miller’s (‘Two-photon filter diagram’) and Max Krummel’s systems.
|
|
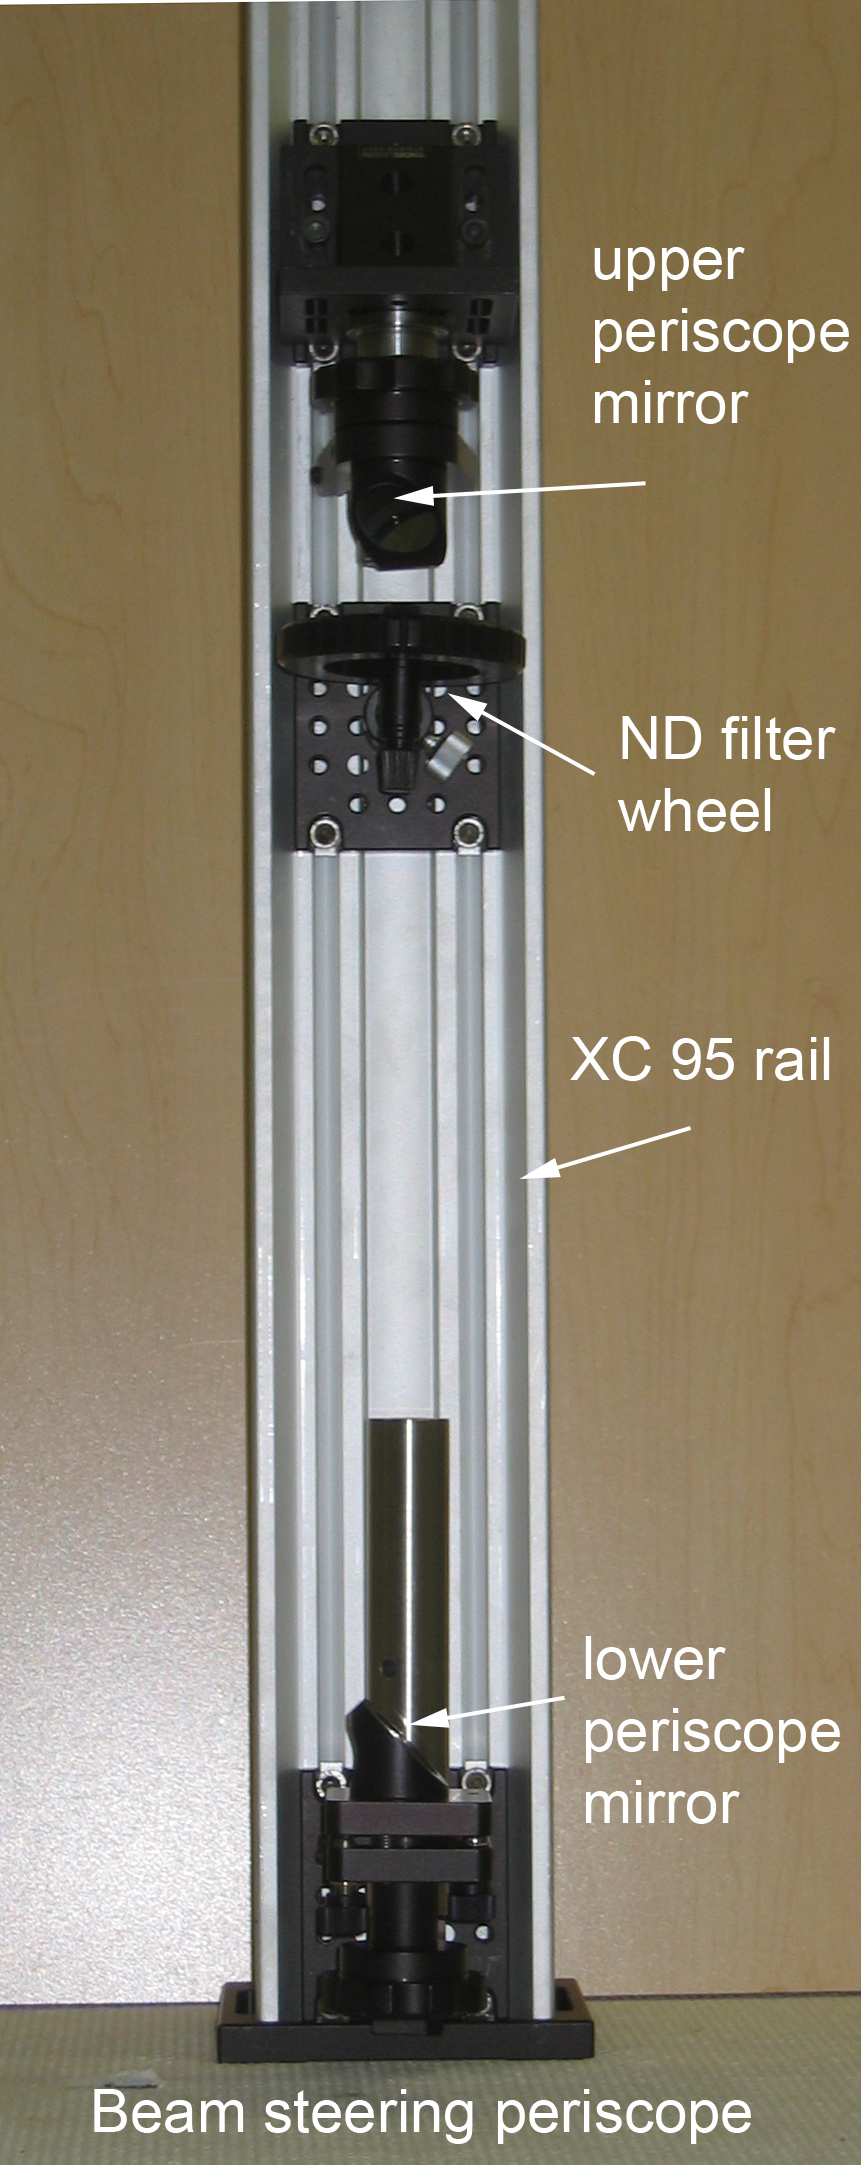
This serves to raise the beam from the femtosecond laser to the height of the scan head, and includes adjustable mirrors for beam alignment, and a variable attenuator to regulate laser intensity at the specimen.
 Beam Periscope
click on image to view at full resolution
Beam Periscope
click on image to view at full resolution |
The periscope is constructed around a very rigid XC 95 extruded aluminum rail, using right-angle mounting plates to hold periscope mirrors in adjustable mounts (see parts inventory). A circular continuous neutral density filter is mounted between the mirrors to regulate attenuation of the beam. (Note: the ND filter wheel specified in the parts inventory will handle the laser power, wheels from other manufacturers may suffer laser damage).
For laser safety, an aluminum sheet cover shields the beam within the periscope assembly, and a metal pipe encloses the beam from the periscope to the scan head (see photo of complete system). |
|
| 5. COMPUTER CONTROL AND ACQUISITION |
Signals from the microscope are acquired and converted to real-time images for display and storage to hard disc by a PC equipped with a Raven analog input board and running Video Savant software with custom drivers and stream filter.
Choice of PC is not critical, but for optimal performance specify fast disc drives and a good video card. Empty PCI slots are needed to accommodate the acquisition card and (if desired) an interface card to control the microscope. Serial port(s) (COM1, COM2) will also be needed if you want to control a focus motor or mortorized stage. Such ports are no longer standard on recent PCs, and you may need to add an interface PCI card.
The Raven board is a universal analog camera interface, that supports simultaneous acquisition from 4 channels at pixel clock rates of 20 MHz (model PCI-440-VNS). Order the board together with an interface cable. The cable terminates in BNC plugs. Connectors labeled Cam0-Cam3 connect directly to the photomultiplier module outputs; H sync and V sync connectors plug into the respective sync outputs on the back of the electronics module. NOTE: BitFlow had announced that they were discontinuing this board as from 1/1/06 . Reports of this death were exaggerated, and they now ( 1/16/06 ) anticipate maintaining production for the indefinite future.
The Video Savant package (IO Industries) interfaces with the microscope to acquire and display images, and can also be used to control the scanner magnification and drive external devices such as a focus motor. Order the ‘Pro’ version, and specify that you need the custom camera files and stream filter developed in conjunction with Mike Sanderson for use with the video-rate scanner. Mike has written a nice article, "Acquisition of Multiple Real-Time Images for Laser Scanning Microscopy," describing the algorithm behind this software. Also, Max Krummel worked with IO Industries to develop a graphical user interface ‘confocal.exe’ allowing image collection together with control of focus motor and motorized stage position. His website gives details on setting up and using the Video Savant software.
|
| 6. SETTING UP AND ALIGNMENT |
The microscope, steering periscope and laser bolt onto a vibration-isolated optical table. Optical tables are available from many suppliers (e.g. Newport Corp). The tables come pre-drilled with either metric or (this being the USA ) imperial threads and hole spacings. Decide whether you want to work in centimeters or inches, then forever after remember to order appropriate matching optical components (it’s easy to mix up part numbers!). A relatively small (3 x 4 ft) table would be sufficient to accommodate the microscope and laser, but it may be better to oversize: the greater mass gives better vibration isolation, and more scope for future expansion. One consideration is that the laser has enough power to split the beam to drive two microscopes mounted on the same table. Be aware that larger tables are big and very heavy. Shipping costs will be high, and you may need to hire a ‘rigger’ with specialized equipment to move the table from the loading dock and install it in your lab.
Max Krummel gives detailed instructions on aligning the laser beam into the microscope.
LASER SAFETY : Be very afraid of the beam from the femtosecond laser! Depending on the wavelength to which the laser is tuned, the beam may either look a dim red or be invisible – but it can burn out your retina in an instant. Commercial manufacturers go to great lengths to protect the user from laser exposure (and themselves from product liability lawsuits!). You do not have this protection when building your own system. Some safety guidelines:
1. Make sure the laser beam is completely enclosed during normal operation; e.g. use metal shields and tubes.
2. Make sure that IR-blocking filters specified for femtosecond imaging are placed before eyepieces, so there is no danger of exposure when looking down the microscope. Do not put these safety filters in removable cubes – someone might switch cubes. Glue or screw them in place!
3. Have appropriate (OD >5 at wavelengths >700 nm) laser safety eyewear readily available.
4. Have all users take a laser safety course. Consult with your institutional laser safety guy.
5. The main danger comes during alignment, when you need to be able to see the laser beam. To reduce the danger, tune the laser to the shortest possible wavelength (its subjective brightness doubles for about every 20 nm shift), and put a neutral density filter immediately in front of the laser to reduce the power to a few mW.
|
110) Nguyen QT, Callamaras N, Hsieh C, and Parker I. Construction of a two-photon microscope for video-rate Ca2+ imaging. Cell Calcium. 30(6): 383–393, 2001.[PDF]
112) Miller MJ, Wei SH, Parker I, and Cahalan MD. Two-photon imaging of lymphocyte motility and antigen response in intact lymph node. Science. 296: 1869-1873, 2002. [PDF]
114) Cahalan MD, Parker I, Wei SH, and Miller MJ, Two photon tissue imaging: Seeing the immune system in a fresh light. Nat. Rev. Immunol. 2:872-880, 2002. [PDF]
116) Stutzmann GE, LaFerla FM, and Parker I. Ca2+ signaling in mouse cortical neurons studied by 2-photon imaging and photoreleased IP3. J. Neurosci. 23:758-765, 2003. [PDF]
117) Miller MJ, Wei SH, Cahalan MD, and Parker I. Autonomous T cell trafficking examined in vivo using intravital 2-photon microscopy. Proc. Natl. Acad. Sci. USA 100:2604-2609, 2003. [PDF]
118) Cahalan MD, Miller MJ, Wei SH, and Parker I. Real-time imaging of lymphocytes in vivo. Curr. Op. Immunol. 15: 372-377, 2003. [PDF]
119) Wei SH, Parker I, Miller M, and Cahalan MD. A stochastic view of lymphocyte motility and trafficking within the lymph node. Immunological Reviews. 195: 136-159, 2003. [PDF]
122) Miller MJ, Hejazi AS, Wei SH, Cahalan MD, and Parker I. T cell repertoire scanning is promoted by dynamic dendritic cell behavior and random T cell motility in the lymph node. Proc. Natl. Acad. Sci. 101 (4): 998-1003, 2004. [PDF]
123) Stutzmann GE, Caccamo A, LaFerla FM, and Parker I. Dysregulated IP3 signaling in cortical neurons of knock-in mice expressing an Alzheimer's-Linked mutation in Presenilin1 results in exaggerated Ca2+ signals and altered membrane excitability. J. Neurosci. 24(2), 508-513, 2004. [PDF]
126) Thorn P, Fogarty KE, and Parker I. Zymogen granule exocytosis is characterized by long fusion pore openings and preservation of vesicle lipid identity. Proc. Natl. Acad. Sci. 101:6774- 6779, 2004. [PDF]
127) Miller MJ, Safrina O, Parker I, and Cahalan MD. Imaging the single cell dynamics of CD4 T cell activation by dendritic cells in lymph nodes. J. Exp. Med. 200(7): 847–856, 2004. [PDF]
129.) Stutzmann GE and Parker I. Dynamic multiphoton imaging: A live view from cells to systems. Physiology 20: 15-21, 2005. [PDF]
130) Thorn P and Parker I. Two phases of zymogen granule lifetime in mouse pancreas: ghost-granules linger after exocytosis of contents. J. Physiol. 563.2: 433-42, 2005. [PDF]
136.) Okada T, Miller MJ, Parker I, Krummel MF, Hartley SB, O'Garra A, Cahalan MD, and Cyster JG. Antigen-engaged B cells undergo chemotaxis toward the T zone and form motile conjugates with helper T cells. PLoS Biol. 3(6):e150, 2005. [PDF]
137.) Zinselmeyer BH, Dempster J, Gurney AM, Wokosin D, Miller M, Ho H, Millington OR, Smith KM, Rush CM, Parker I, Cahalan M, Brewer JM, and Garside P. In situ characterization of CD4 + T cell behavior in mucosal and systemic lymphoid tissues during the induction of oral priming and tolerance. JEM 201:1-9, 2005. [PDF]
140.) Wei SH, Rosen H, Matheu MP, Sanna MG, Wang SK, Jo E, Wong CH, Parker I. and Cahalan MD. Sphingosine 1-phosphate type 1 receptor agonism inhibits transendothelial migration of medullary T cells to lymphatic sinuses. Nat Immunol. vol. 6:1228-1235, 2005. [PDF]
Note: The number correspond to the publication number in the Parker Lab website under "Publications-Book Chapters "
14) Sanderson MJ and Parker I. Video-rate confocal microscopy. Methods in Ezymology 360:447-480, 2003. [PDF] |
|
|
| |
1146 Mc Gaugh Hall
University of California, Irvine
Irvine, CA 92697-4550
Lab Tel: 949-824-7833 |
back to >Microscopy Construction |
last updated 01/20/2006. Please send enquiries to ianparkerlabweb@gmail.com
|
|