|
|
|
Microscopy Construction
"Multi-focal" Imaging
by Angelo Demuro and Ian Parker
|
INTRODUCTION
Elementary events such as puffs and sparks are cytosolic microdomains of Ca 2+ from which cellular Ca 2+ signals are constructed. Because of the tight localization and fast kinetics of elementary events, imaging studies have been hindered by instrumental limitations of confocal and deconvolution fluorescence microscopy which necessitate compromises between spatial and temporal resolution. Here, we describe a novel, yet simple 'multi-focal' fluorescence microscopy system that employs three high-speed cameras focused at different axial depths to enable 4-dimensional imaging with millisecond resolution. We demonstrate the utility of this system for studies of puffs in Xenopus oocytes by mapping the axial distribution of puff sites, by obtaining measurements of puff amplitudes undistorted by focus error, and by deriving deblurred images that reveal novel sub-micron jumps of Ca 2+ release sites.
|

Figure 1: Simultaneous multi-focal imaging system. (A)Schematic of the triple-camera system, constructed on an optical breadboard located at the side-port of an Olympus IX 71 inverted microscope. Cam1, Cam2 and Cam3 are identical Cascade 128+ cameras, each mounted on single-axis translation stages allowing their distances from the focal plane of the microscope to be independently varied. BS1 is a beam splitter that reflects 30% of the emitted fluorescence light toward Cam1. The remaining light is then divided equally between Cam2 and Cam3 by BS2, a beam splitter with 50/50 transmission/reflection. Both beam splitters are fixed on adjustable mirror mounts allowing fine alignment of tilt in x and y axes to superimpose the images formed by the three cameras. The diagram is not to scale, and differences in path lengths for the cameras are exaggerated for clarity. (B) Axial (x-z) point-spread functions (p.s.f.) for the 3 individual cameras (pseudocolored in red, green and blue) obtained by focusing through a sub-resolution (100 nm) fluorescent bead. (C) Enhancement of the microscope p.s.f. by applying a 'deblurring' algorithm to images from the three cameras. The upper row shows selected frames from the center camera while focusing through a 100 nm fluorescent bead embedded in agarose. The lower row shows corresponding images after correction for out-of-focus fluorescence by subtracting smoothed (15x15 pixels), averaged images acquired at focal planes 250 nm above and below the center camera. Axial depths are indicated in mm relative to the bead. Calibration bar = 3 mm. |
|
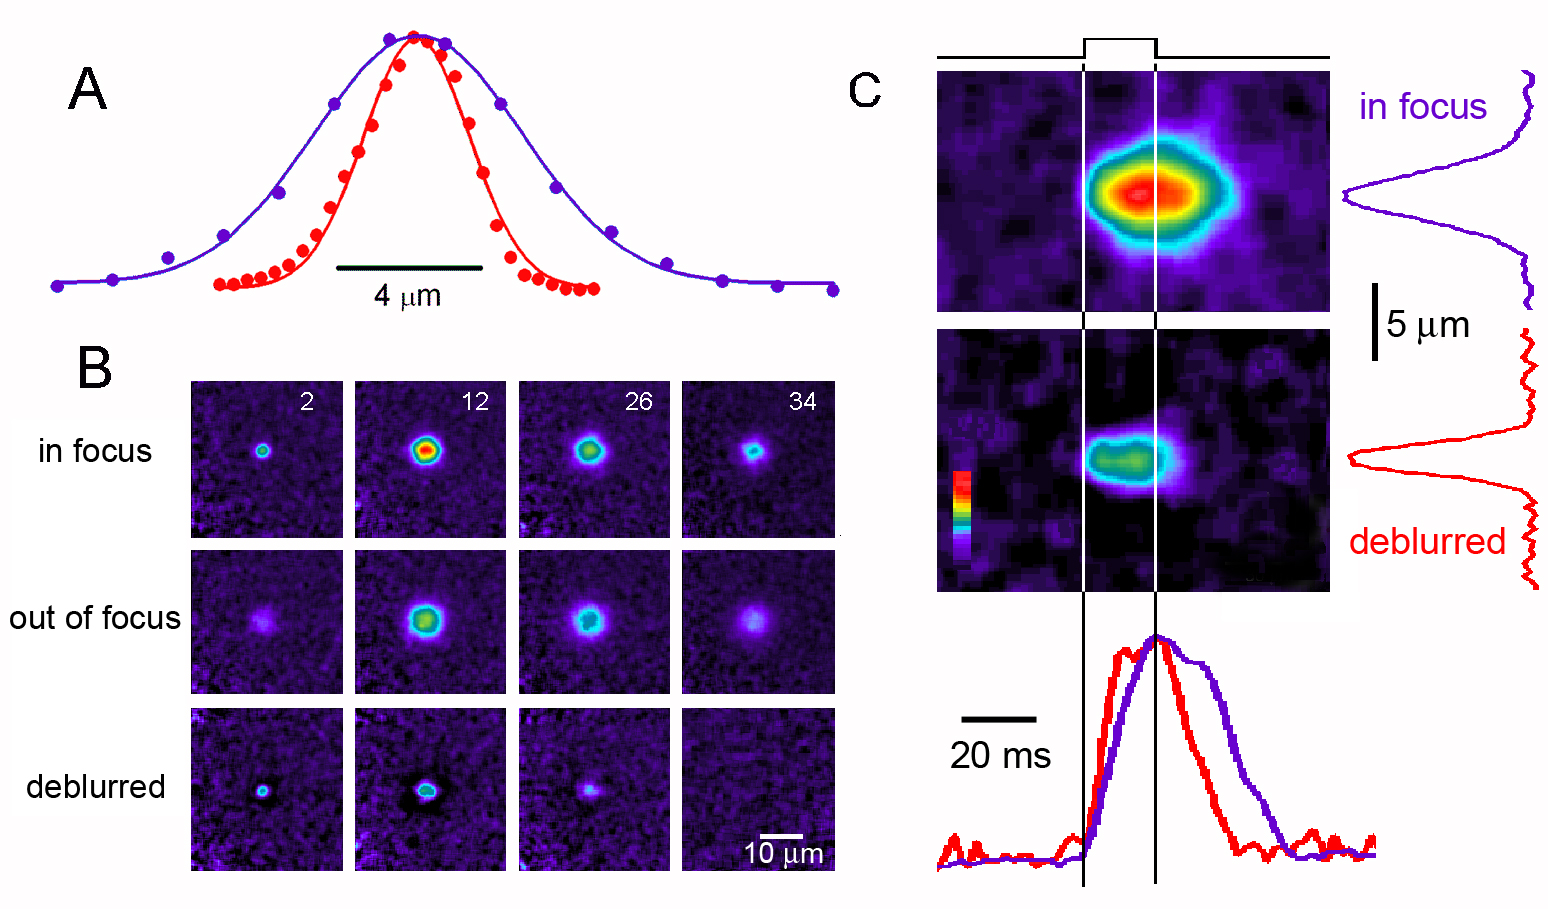
Figure 2. Multi-focal imaging of 'model' Ca 2+ puffs evoked by ionophoresis of Ca 2+ from a micropipette into a solution of indicator dye. (A) Comparison of the axial p.s.f. of the microscope derived using a sub-resolution fluorescent bead (red curve) with the axial distribution of fluorescence resulting from diffusional spread of Ca 2+ from the tip of the ionophoretic pipette (purple curve). Fluorescence intensities are depicted on a blue-red pseudocolor scale, uniform for all images, with red corresponding to the brightest signal in the in-focus images. (B) Selected frames captured at different times during and after an ionophoretic Ca 2+ pulse. The top sequence was obtained from a plane focused on the pipette tip, and the middle sequence from a plane 4 m m below. Numbers in the top frames indicate time (in ms) following onset of the 20ms duration ionophoretic pulse. The lower sequence shows corresponding images after applying the 'deblurring' algorithm (see text) to correct for out-of-focus fluorescence. (C) Line-scan (x-t) images derived from the full image sequences in B, show the fluorescence signals from the model puff before (top image) and after (bottom image) deblurring. Traces at the right show corresponding spatial profiles of fluorescence measured at the time of peak response, and the traces at the bottom show corresponding temporal profiles measured at the location of the pipette tip. Purple traces were obtained from linescan images of the raw in-focus signal, and red traces from the deblurred signal. The duration of the ionophoretic Ca 2+ pulse is indicated by the vertical lines. Amplitudes are normalized to facilitate comparison.
|
|
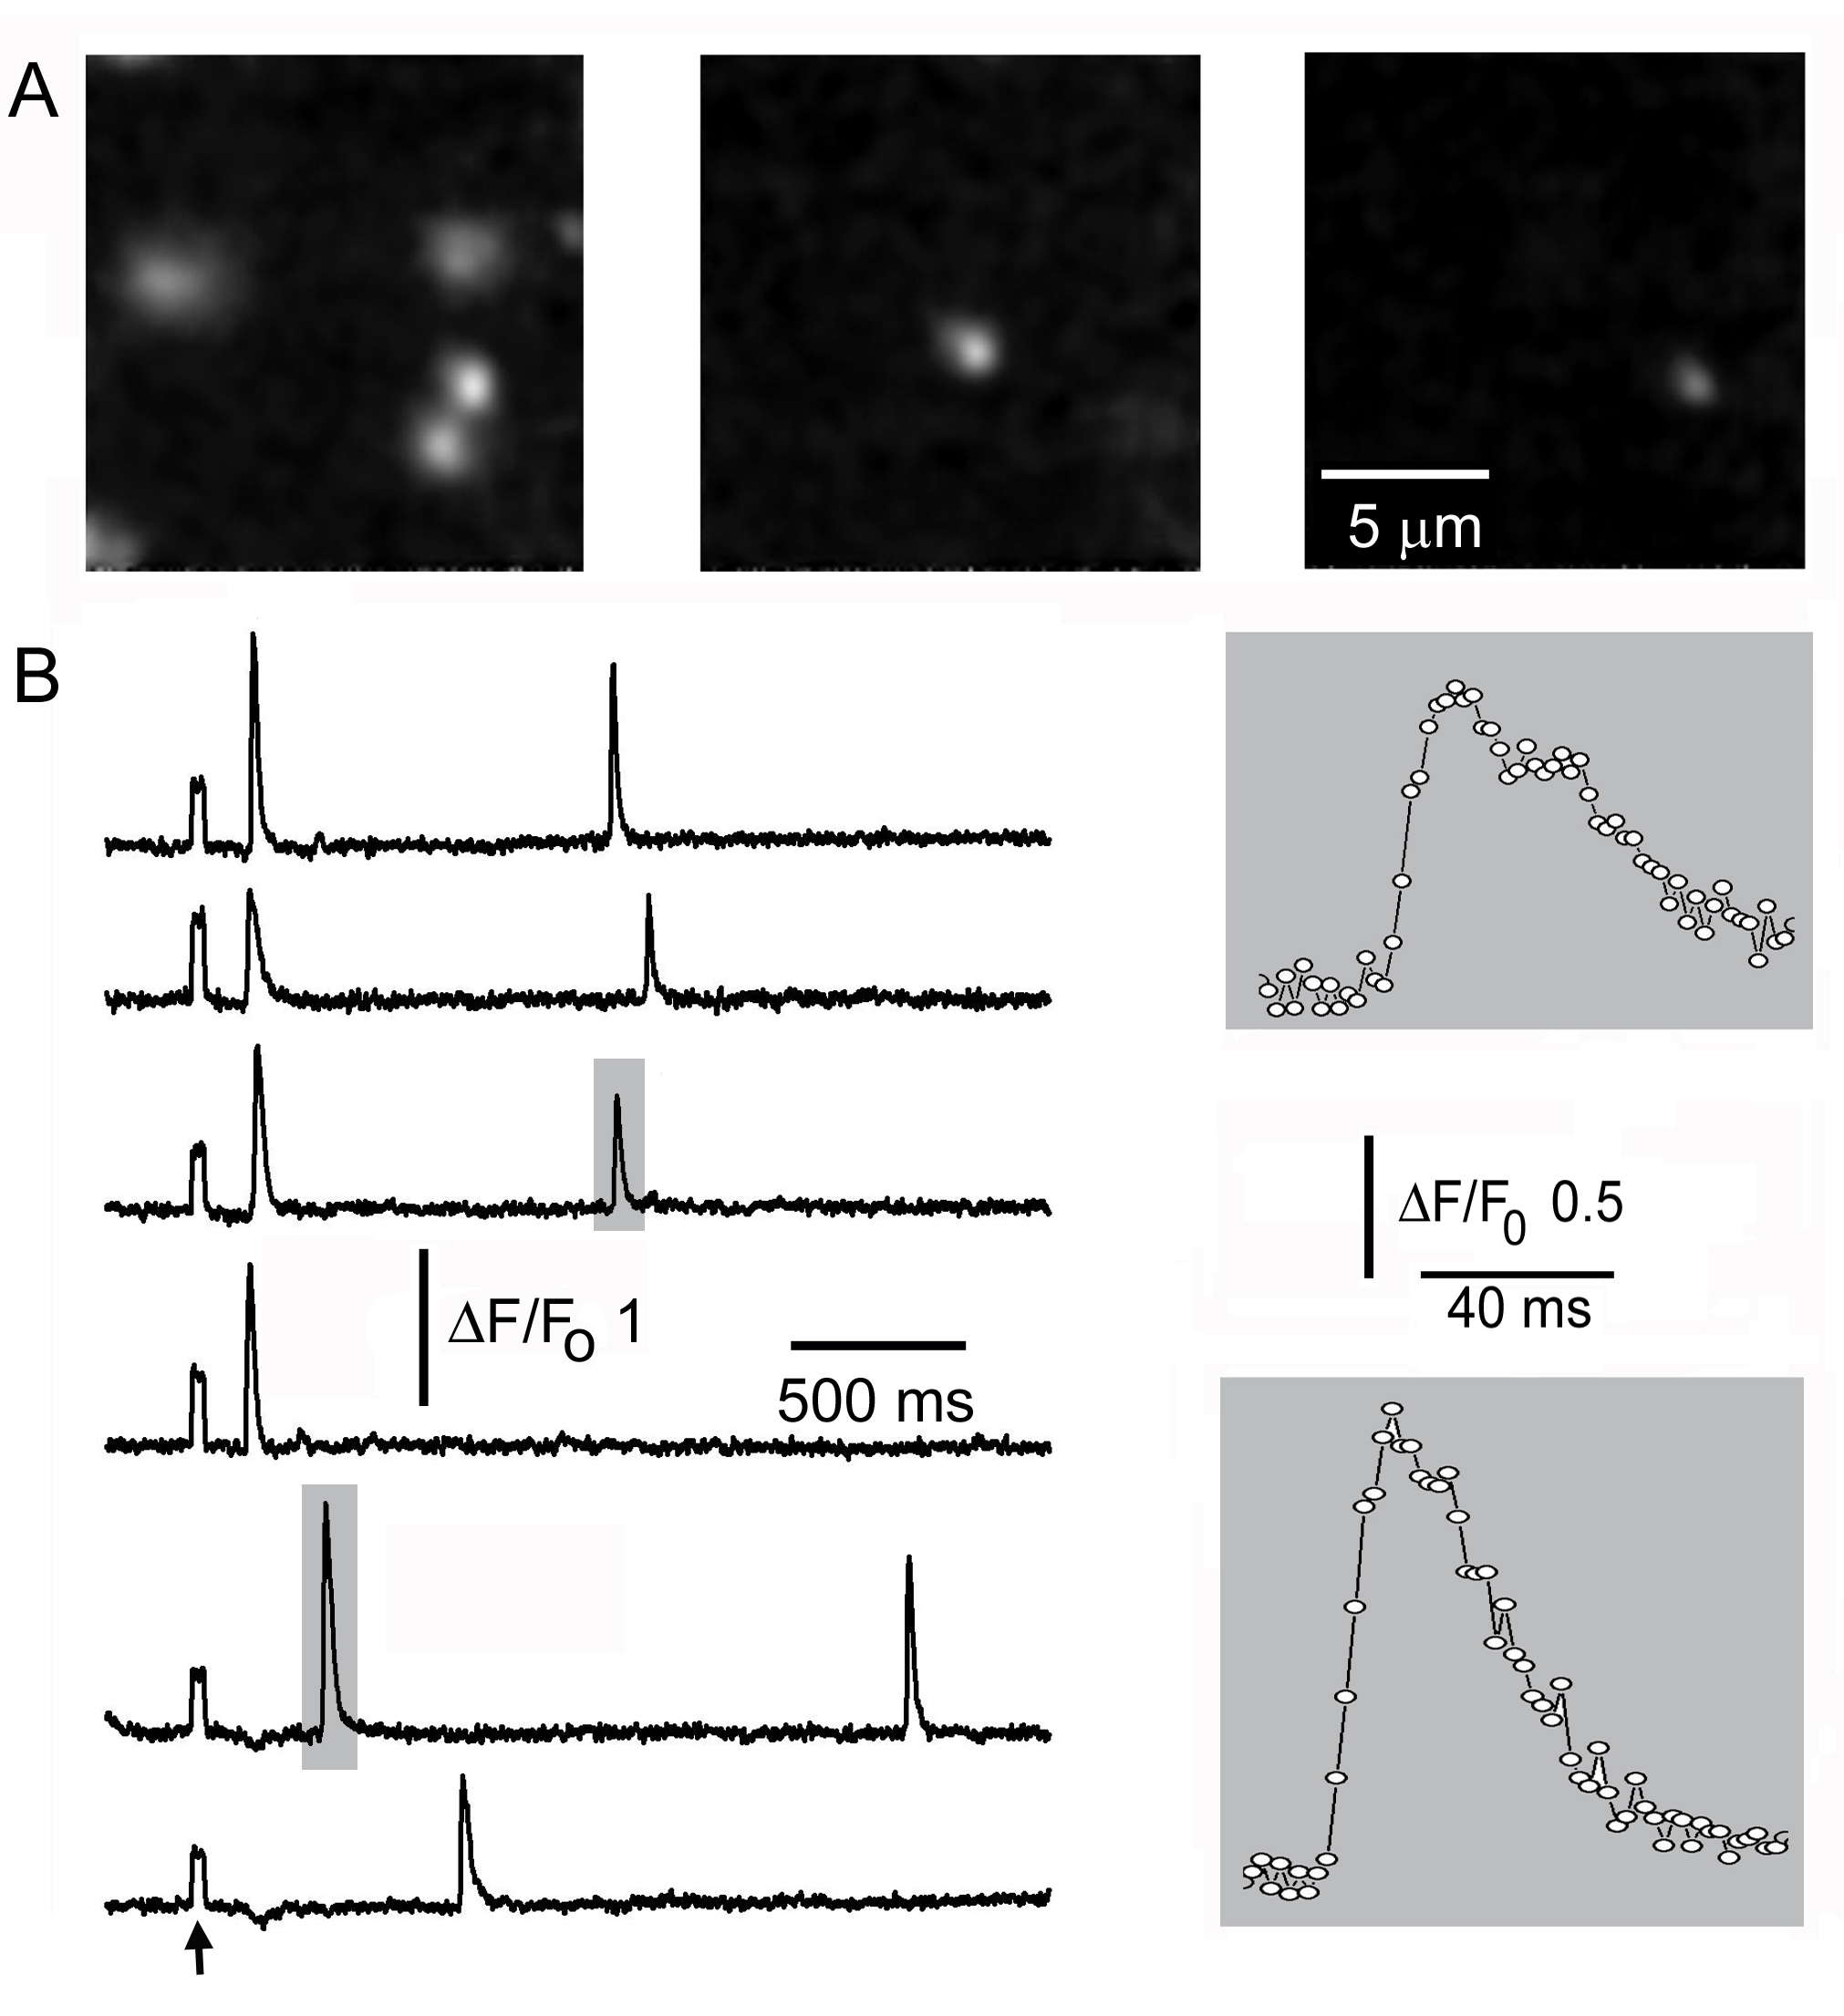
Figure 3. Time-resolved imaging of IP 3-evoked Ca 2+ puffs in Xenopus oocytes. (A) Representative single frames ( a few hundred ms apart) taken from a sequence acquired at 2 ms intervals show fluorescence ratio changes ( DF/Fo) of the calcium indicator fluo-4 imaged by Cam2. A flash of UV light (arrow marks flash artifact) uniformly illuminating the imaging field was applied 1 s before the first image to photoreleased IP 3, resulting in Ca 2+ puffs at multiple locations after variable latencies. (B) Traces illustrate the fast kinetics of puffs, monitored simultaneously at 2 sites from (1.2 x 1.2 mm) regions of interest on the Cam2 image. The puffs indicated by shaded boxes are shown on an expanded time scale on the right. Data points are at 2 ms frame intervals.
|
|
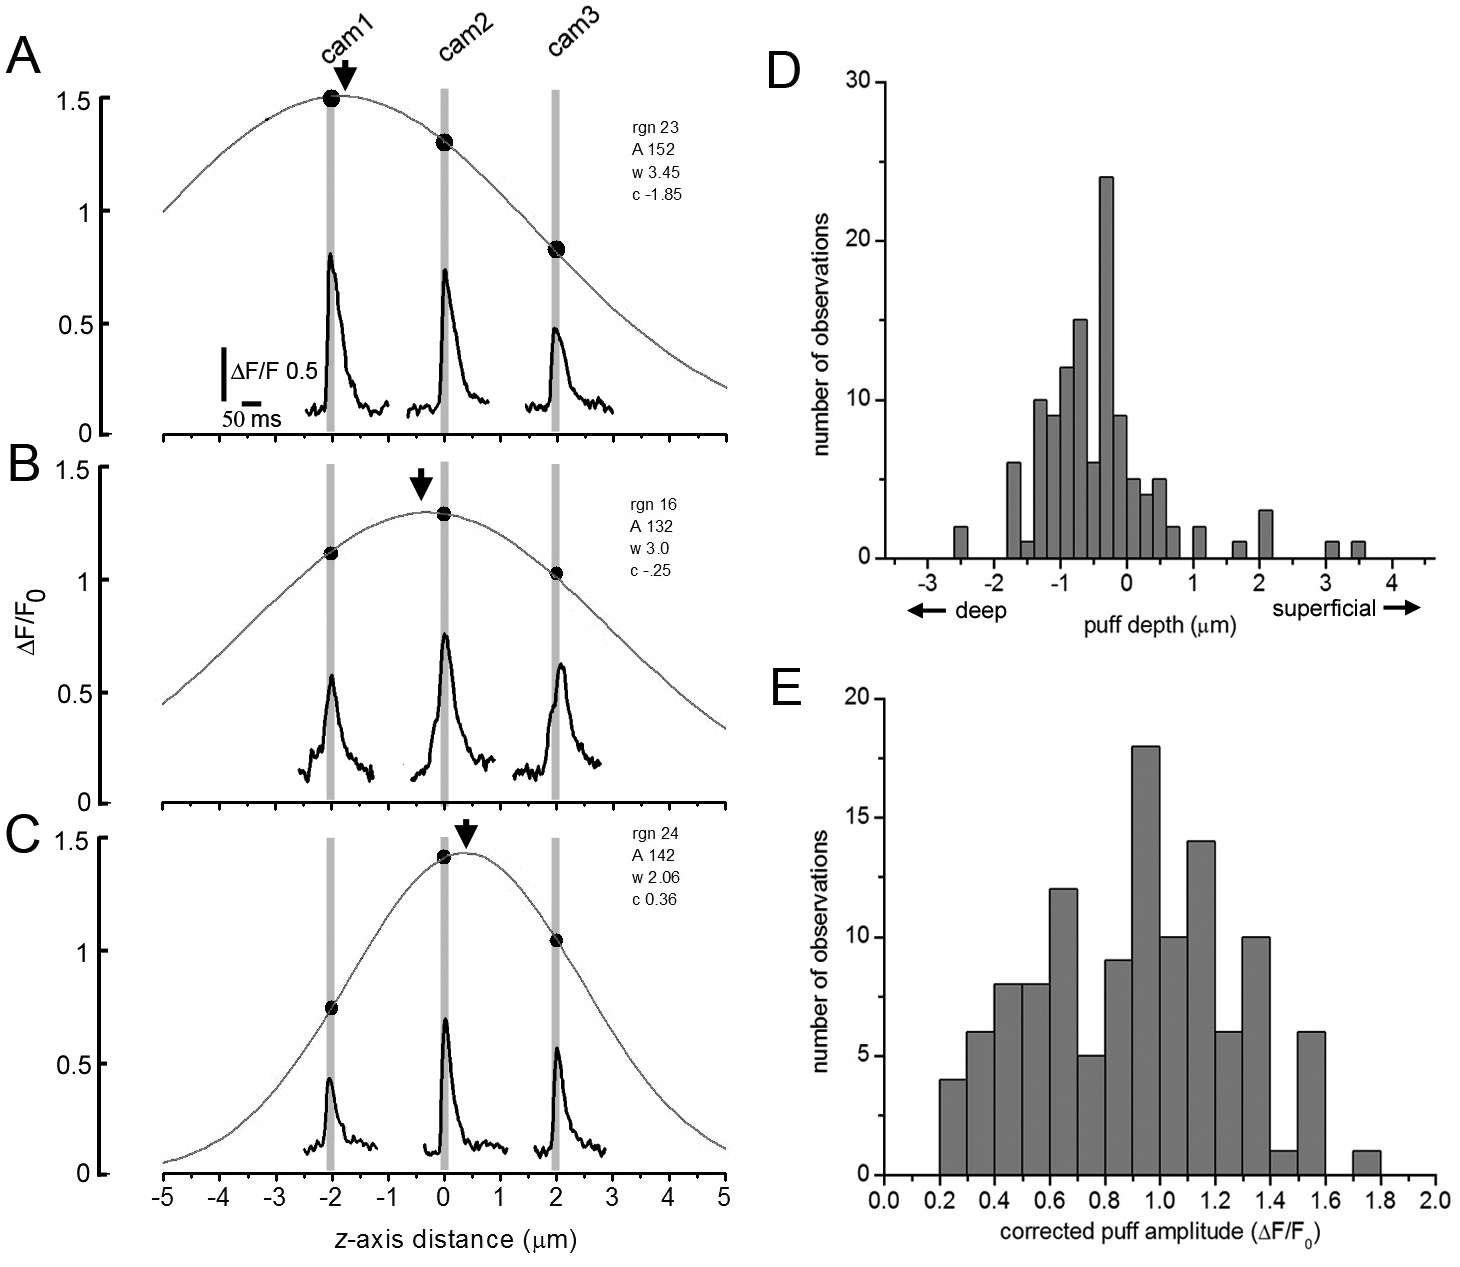
Figure 4.Axial localization and amplitude correction of puffs by multi-focal imaging. (A) Example of a single puff imaged simultaneously by the three cameras (Cam1, Cam2, Cam3) focused at 2 mm increments in the z axis. Inset traces show fluorescence ratio changes monitored from identical small (1.2 mm square) regions of interest in the image sequences captured by each camera. The main graph plots the peak puff magnitude as a function of the axial displacement of the focal planes in the specimen relative to Cam2. The smooth curve is a Gaussian fit to the data. In this instance, the greatest puff amplitude was recorded by Cam1, indicating that the puff arose at a depth in the oocyte ( peak of Gaussian marked by arrow) close to the focus of that camera. (B,C) Corresponding examples of puffs that originated at differing axial depths. (D) Axial distribution of puff sites in the oocyte. The histogram shows the numbers of observed puff sites as a function of depth as determined from the peaks of Gaussian fits as illustrated in A-C. Depths are referenced to the object plane of Cam2, which was focused by eye at the level of the thin shell of pigment granules in the oocyte. (E) Distribution of peak puff amplitudes obtained after correcting for distortion by out-of-focus events. For each puff, the amplitude was taken as the peak amplitude of a Gaussian fit to the ‘raw’ amplitude data derived from the three cameras, as illustrated in A-C. Data in D,E are derived from measurements of 110 puffs.
|
|
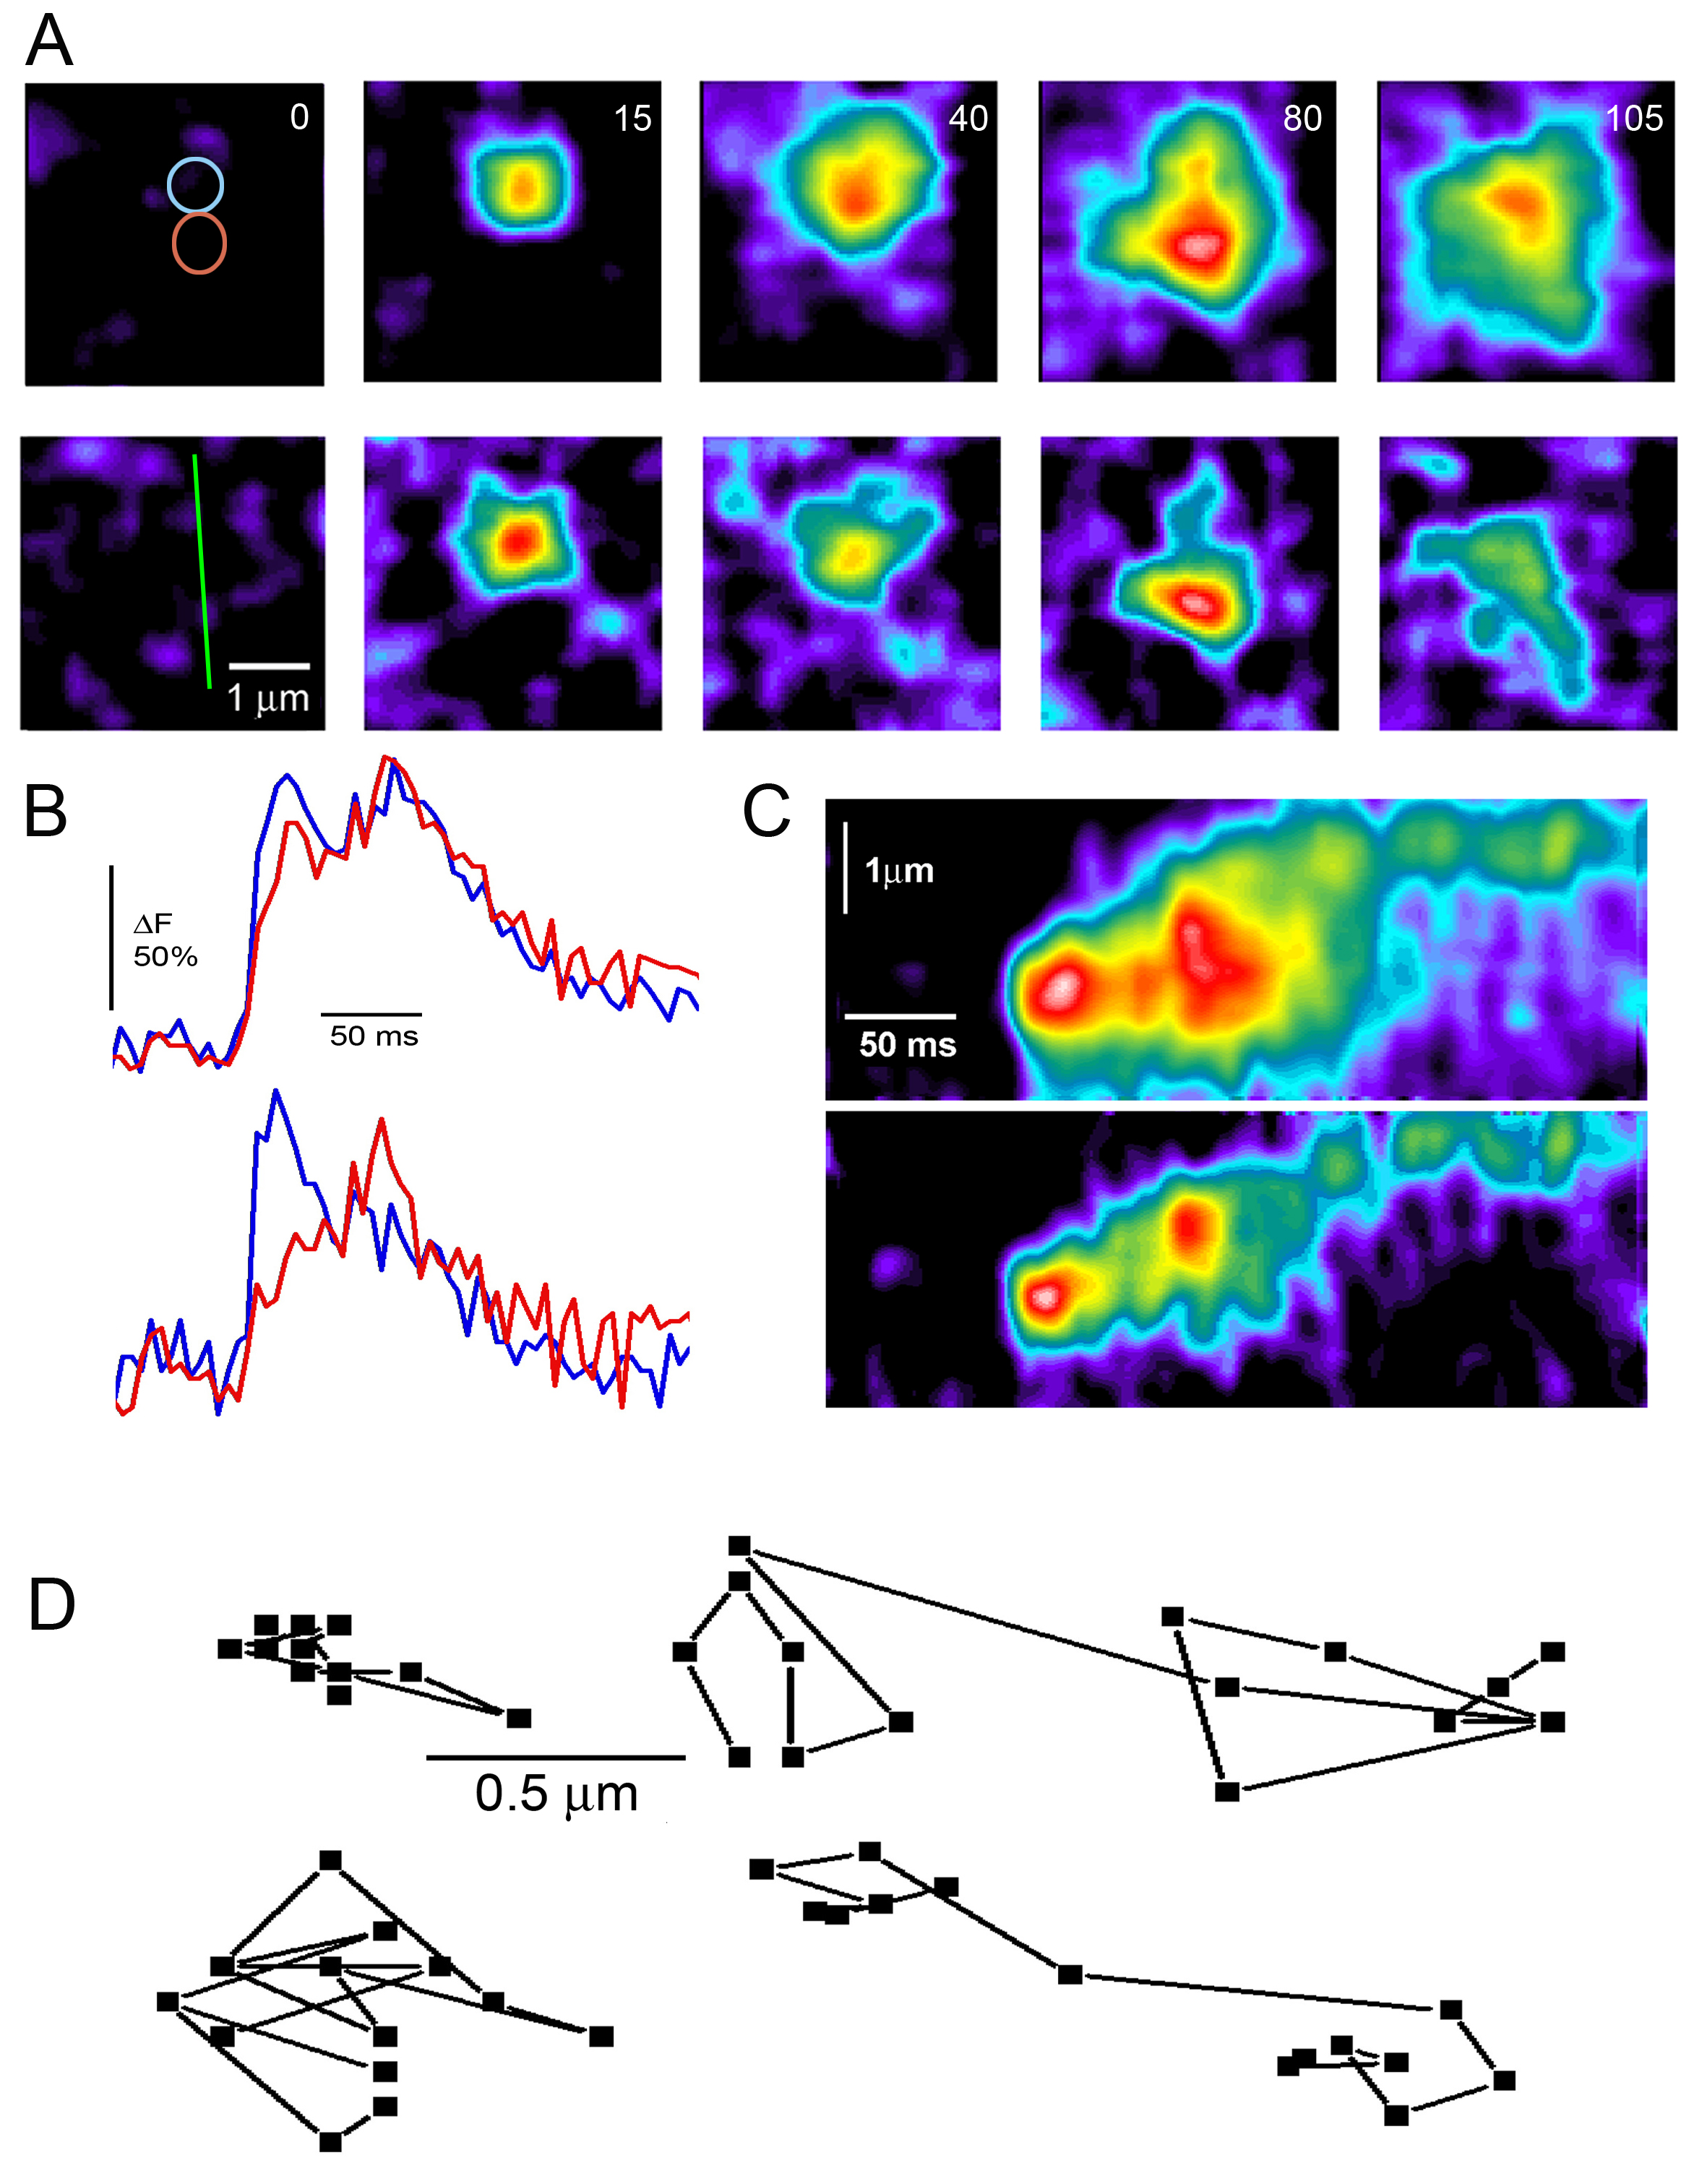
Figure 5.‘Calcium deblurring’ of multi-focal puff images. (A) The top image sequence shows the spatio-temporal evolution of a single puff, as captured by Cam2. Each panel is a single frame (5 ms integration time), acquired at times indicated in ms. The lower image sequence shows the same event after ‘deblurring’ by subtracting a smoothed average of frames acquired by Cam1 and Cam3 from the corresponding Cam2 image. See Methods for further details. Colored circles in the top left frame indicate the regions of interest used to derive fluorescence profiles in (B), and the green line in the lower left frame marks the region used to derive the linescan images in (C). Increasing fluorescence ratio (increasing [Ca 2+]) is depicted on a pseudocolor rainbow scale, normalized separately in the raw and deblurred image sequences (but consistently within each sequence), with white corresponding to the greatest increase. (B) Temporal evolution of fluorescence signals measured from the two correspondingly colored circular regions (0.9 mm diameter) marked in (A). The top pair of traces were obtained from the upper, unprocessed Cam2 image sequence and the lower pair from the deblurred sequence. (C) Linescan images depicting changes in fluorescence along the scan line marked in (A) derived from the raw Cam2 images (top) and deblurred images (bottom). Note that the deblurred images (A,C) and profiles (B) clearly reveal that the puff involves two spatially- and kinetically distinct sites of Ca 2+ liberation, whereas this is barely evident in the unprocessed Cam2 data. (D) Tracking the sites of Ca 2+ release during puffs. Data are shown for 4 puffs arising at different sites in the same imaging record, and plots show the x-y coordinates of the centroid of the deblurred fluorescence signal at 5 ms increments throughout the durations of the puffs. The examples at the left are typical of ‘stationary’ puffs, whereas those at the right show ‘jumping’ puffs.
|
|
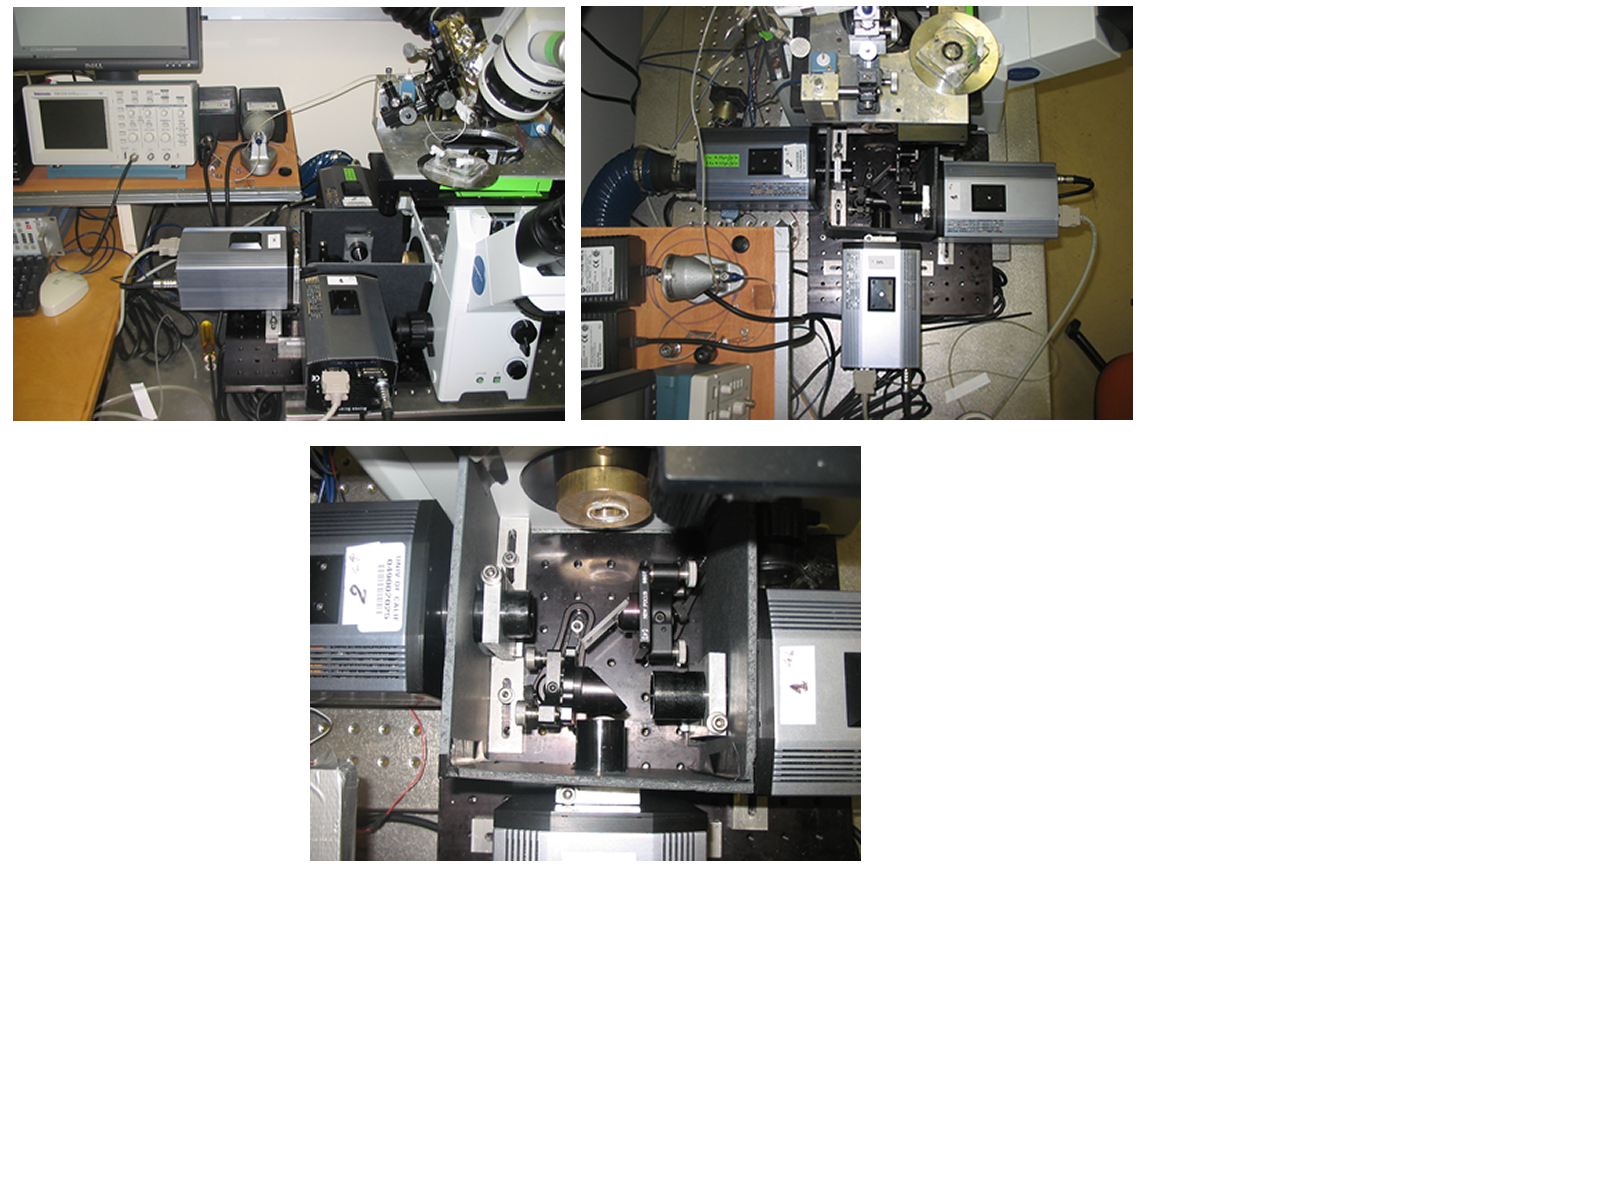
| Figure 6. Images of the mulit-focal three camera set-up. |
|
1146 Mc Gaugh Hall
University of California, Irvine
Irvine, CA 92697-4550
Lab Tel: 949-824-7833 |
back to >Microscopy Construction |
last updated 07/07/2007. Please send enquiries to ianparkerlabweb@gmail.com
|
|